MIKE PORTFOLIO

We aim to source and deliver targeted Surveying, GIS| Remote Sensing, and Data Analysis intelligence to our clients, helping them reduce losses.

Profile-Image

HELLO

MY NAME IS MICHAEL C

I'm a skilled Surveyor, GIS/Remote Sensing Analyst, and Data Analyst. I hold a Bachelor's degree in Surveying and Geoinformatics from Enugu State University of Science and Technology, Where I developed a strong foundation in spatial analysis, data visualization, and geoinformatics technologies. To further enhance my skills, I earned certifications from the University of Toronto through Coursera in:
1. Spatial Analysis and Satellite Imagery in GIS
2. Introduction to Data Science
With a passion for leveraging advanced tools to solve complex problems,
Beyond academics, I have actively engaged in volunteering and mapping initiatives with global platforms and organizations. My contributions include:

  • OpenStreetMap projects, enriching geographic data for various regions

  • Citizen Science mapping initiatives

  • Participation in GLOBE Observer, a NASA-sponsored project dedicated to Earth observation and environmental monitoring

  • I am dedicated to delivering impactful solutions in the fields of Surveying, GIS, and Data Analytics.

    Our Services

    Geographic Information System

    I specialize in providing comprehensive GIS services tailored to meet diverse needs. From data collection and spatial analysis to advanced mapping and visualization, my expertise ensures precise and actionable insights. Whether it's urban planning, environmental monitoring, or custom GIS applications, I deliver innovative solutions that drive results and support informed decision-making.

    Data Analysis

    I offer professional data analysis services designed to uncover patterns, trends, and valuable insights from complex datasets. By leveraging tools like Power BI, Python, and ArcGIS, I transform raw data into clear, actionable reports and visualizations. Whether it's for decision-making, performance optimization, or predictive modeling, my expertise ensures precise analysis that aligns with your goals.

    Academic Research

    I can help conduct a comprehensive literature review, summarizing relevant academic papers, articles, and books. My capabilities include gathering data through surveys, experiments, or accessing databases. Field work or practical investigations can be facilitated depending on the nature of your project.

    Project Management

    I can assist in identifying project milestones, setting deadlines, and allocating resources effectively. I can help break down your project into manageable tasks and assign them to team members. I can assist in tracking task progress and ensuring that deadlines are met.

    Our Recent Projects

    LULC_1990_2005-Image

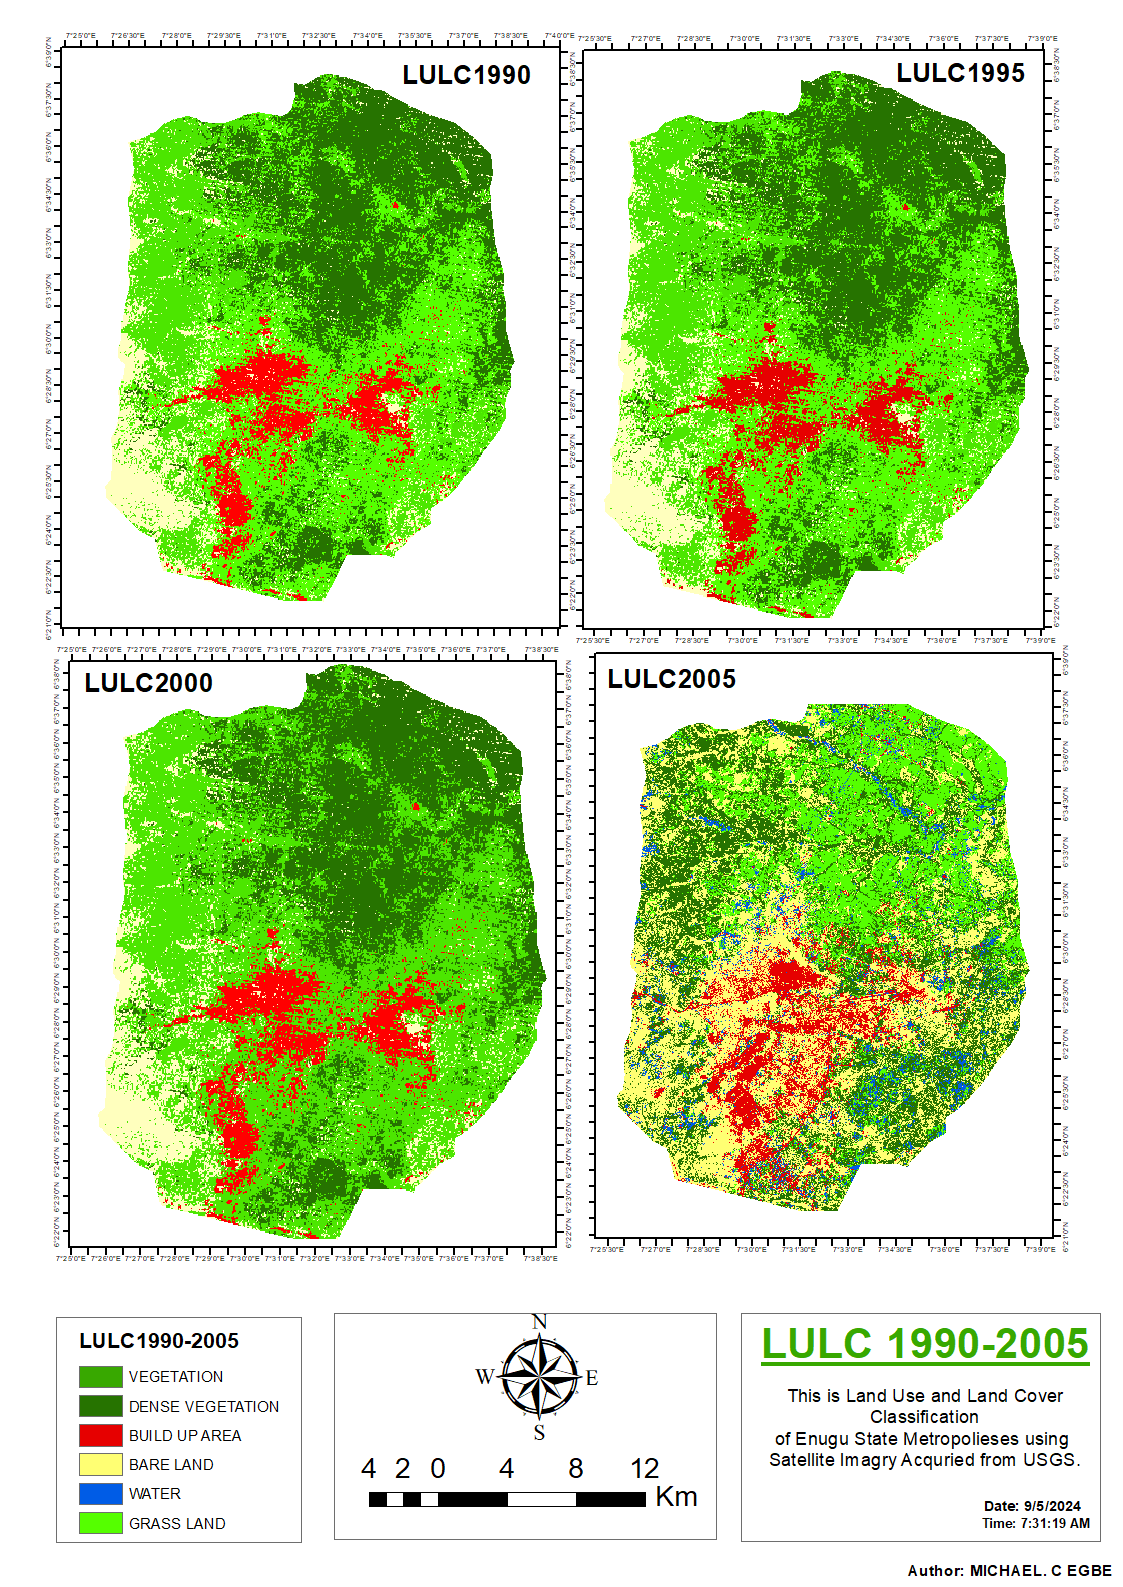
    The image presents Land Use and Land Cover (LULC) maps for Enugu State Metropolises from 1990 to 2005. These maps were derived from satellite imagery obtained from USGS.

    The LULC categories depicted on the map include:

    • Vegetation: Light Green
    • Dense Vegetation: Dark Green
    • Build-up Area: Red
    • Bare Land: Yellow
    • Water: Blue
    • Grass Land: Olive Green

    The time periods covered include 1990, 1995, 2000, and 2005. There is a clear progression and increase in build-up areas (red) over time, particularly in the southern part of the map, indicating urban expansion. Vegetation and dense vegetation show changes over the years, with slight decreases in certain areas, possibly due to urbanization and land development.

    The map uses a standard north-facing compass for orientation and a scale bar in kilometers, showing the spatial extent of analysis (approximately 12 kilometers).

    The author of the map is Michael C. Egbe, and the map was completed on September 5, 2024.

    Project-2-Image

    Application in Anambra West


    The NDWI map of Anambra West, Nigeria, provides valuable insights into the water distribution within the region.
    By analyzing this map, stakeholders can make informed decisions regarding water resource management, environmental conservation, and infrastructure development.
    This is particularly important in regions prone to water scarcity or flooding, as it helps in planning and implementing effective strategies for sustainable development.
    Project-3-Image

    Total PM in Texas 2023:

    Color Range & Legend:
    The color scale ranges from light green to dark red, representing increasing concentrations of particulate matter (PM2.5 or PM10). The concentration values in the legend indicate:

    • Green (lower PM): 4.40 to 6.49
    • Yellow (medium PM): 7.81 to 9.86
    • Orange/Red (higher PM): 9.86 to 13.75

    Spatial Distribution:
    The central and western parts of Texas show lower levels of particulate matter (green to yellow zones), indicating relatively cleaner air in these regions. In contrast, the eastern and southern parts of Texas (orange to red zones) show higher PM concentrations, suggesting regions with poorer air quality. The clustering of dark red areas highlights regions experiencing the highest pollution levels, likely urbanized or industrial areas.

    AQI of Texas 2023:

    Color Range & Legend:
    The AQI map also uses a color gradient from green (good) to red (unhealthy), corresponding to AQI values:

    • Green: 32.19 to 32.56 (good air quality)
    • Yellow: 32.56 to 39.43 (moderate air quality)
    • Orange/Red: 39.43 to 55.64 (unhealthy air quality)

    Spatial Distribution:
    Like the PM map, western and central Texas show better AQI values (green and yellow regions), indicating better air quality. Eastern and southern Texas exhibit higher AQI values (orange to red zones), signaling degraded air quality in those areas.

    Relationship Between PM and AQI:

    The graph on the right compares PM and AQI for Texas in 2023. There appears to be a positive correlation between PM and AQI; as PM increases, AQI also rises, reflecting worsening air quality. This suggests that particulate matter levels significantly influence the air quality in Texas.

    Project-3-Image

    Application in the Study Area
    The point cloud map of the study area is an invaluable tool for researchers, planners, and decision-makers.
    It allows for detailed examination of the geographical features and provides a foundation for various analyses, such as assessing environmental impacts, planning infrastructure projects, or monitoring changes over time.
    By leveraging this detailed spatial data, stakeholders can make informed decisions that lead to sustainable and effective outcomes.
    Image-1 Image-2

    ESRI Image date Finder
    The ESRI Image Date Finder is a powerful tool for anyone working with geospatial data, providing essential date information for a wide range of applications.
    Image-3
    Topographic Wetness Index (TWI) Map of Anambra East, Nigeria

    The image represents a Topographic Wetness Index (TWI) map for Anambra East, Nigeria. This map is a valuable tool for understanding the distribution of wetness across the region.
    The TWI is a measure used in hydrology and environmental studies to indicate areas that are likely to be wetter or have a higher potential for soil saturation.

    The author of the map is Michael C. Egbe, and the map was completed on September 5, 2024.

    Contact Us

    Contact Us