Geographic Information System & Remote Sensing
Harness the power of location intelligence: LULC, terrain analysis, thematic mapping, and spatial modeling. Every project combines satellite imagery, field data, and advanced GIS processing.
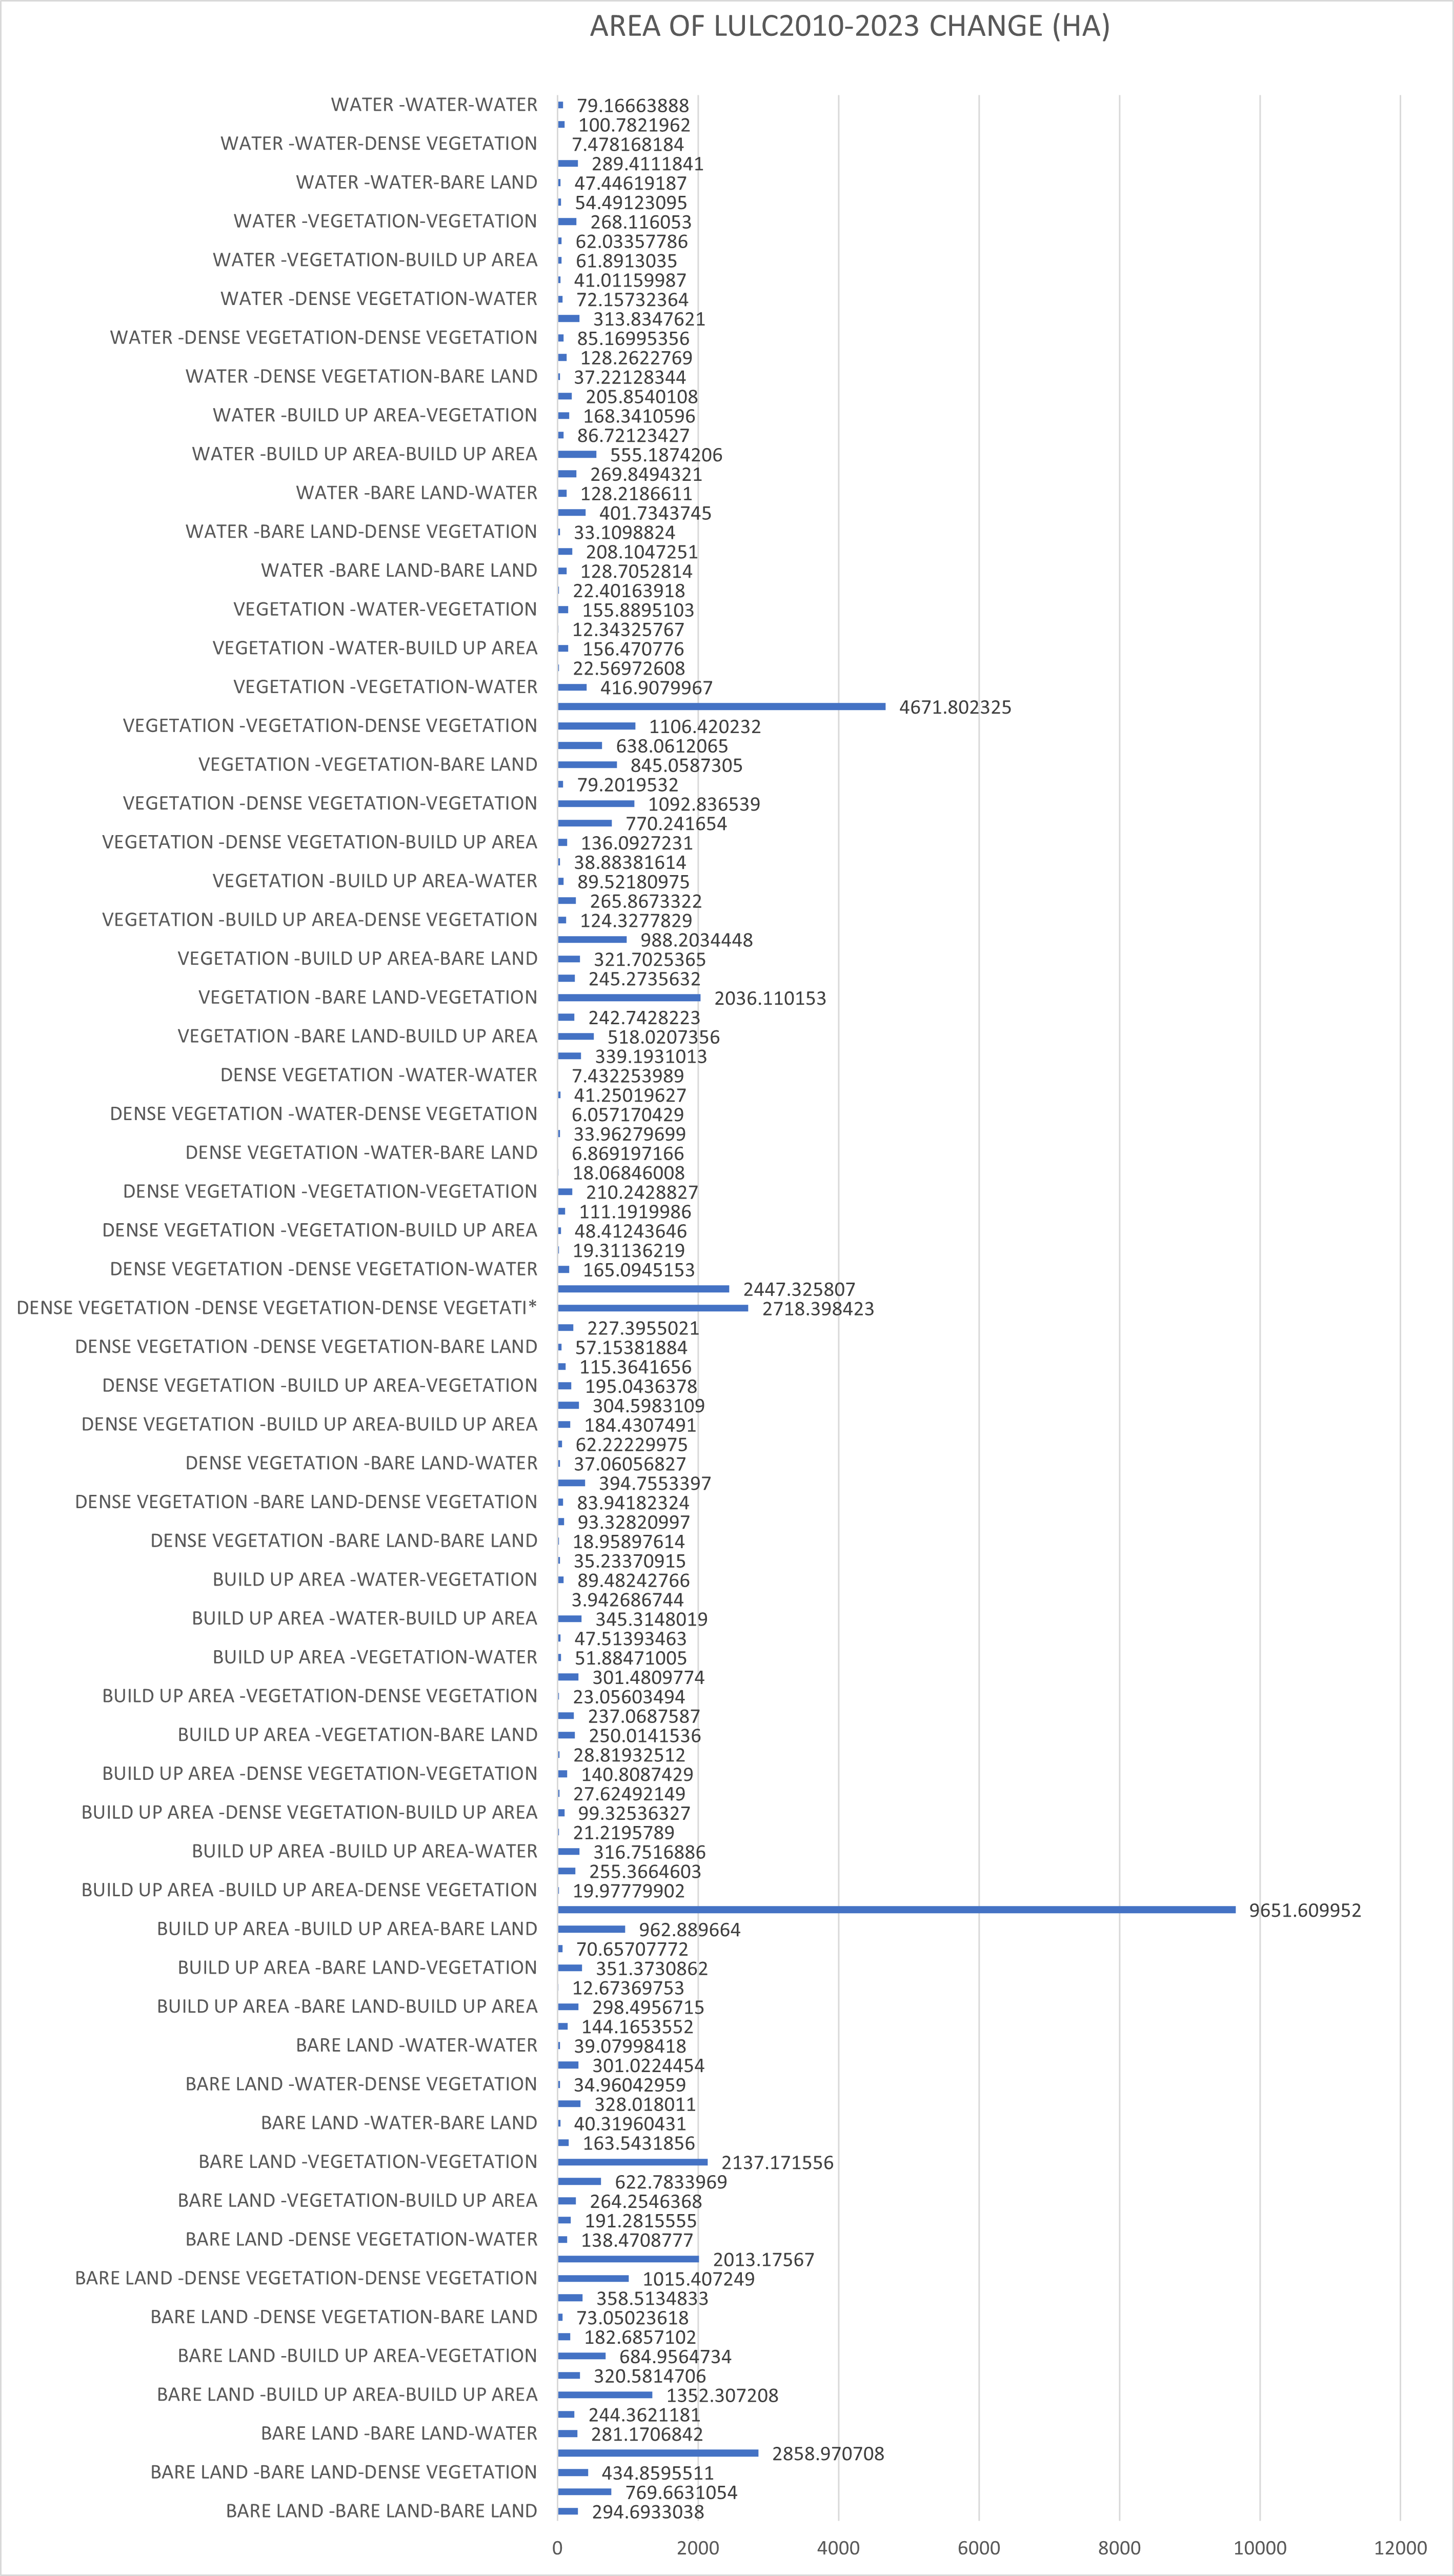
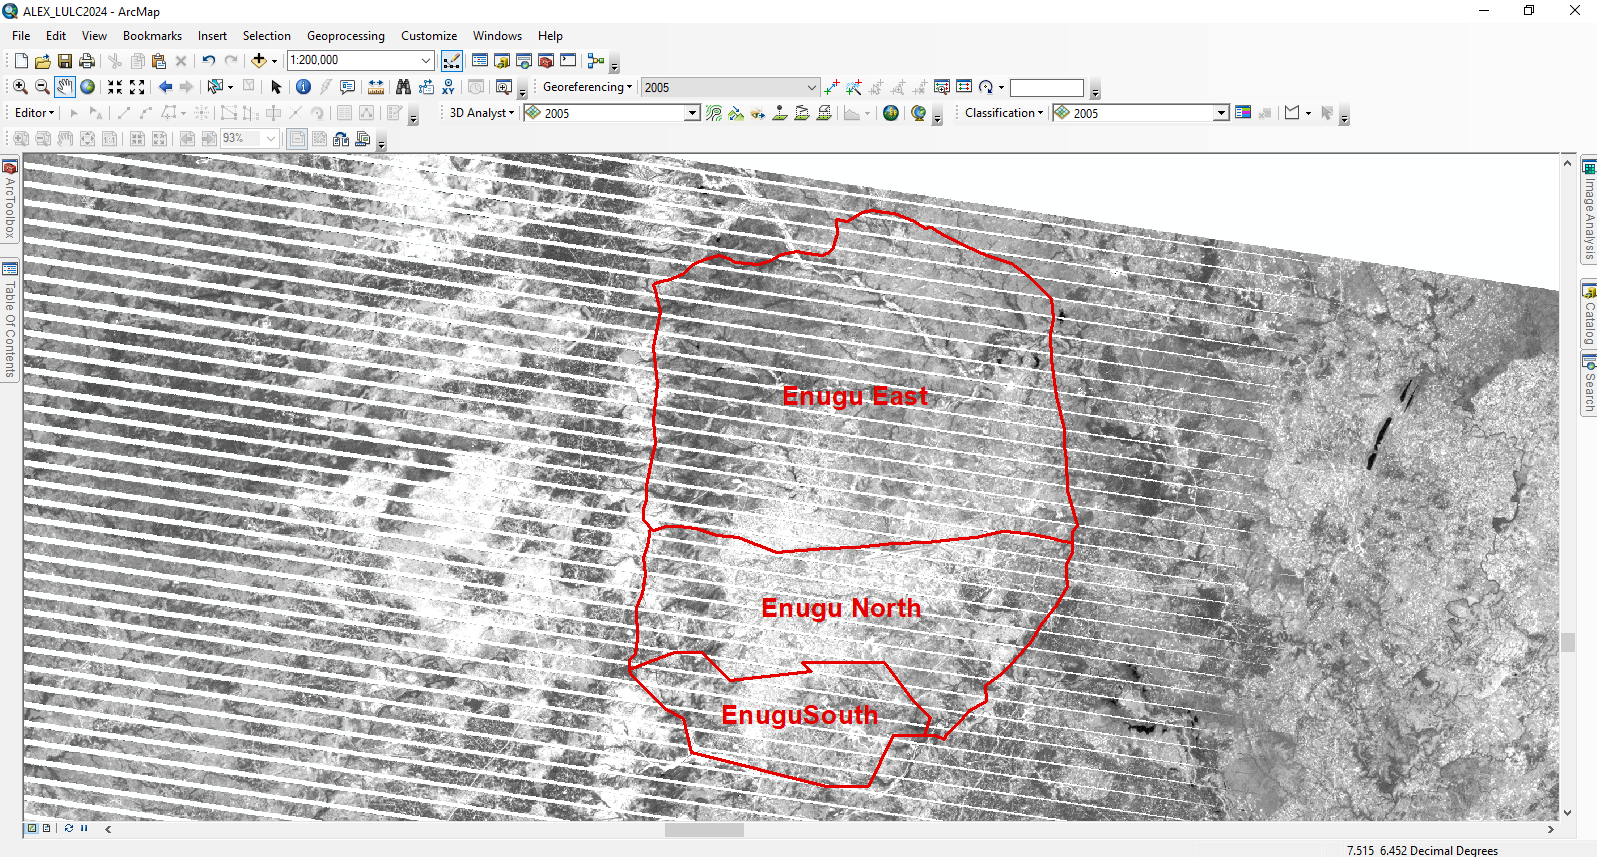
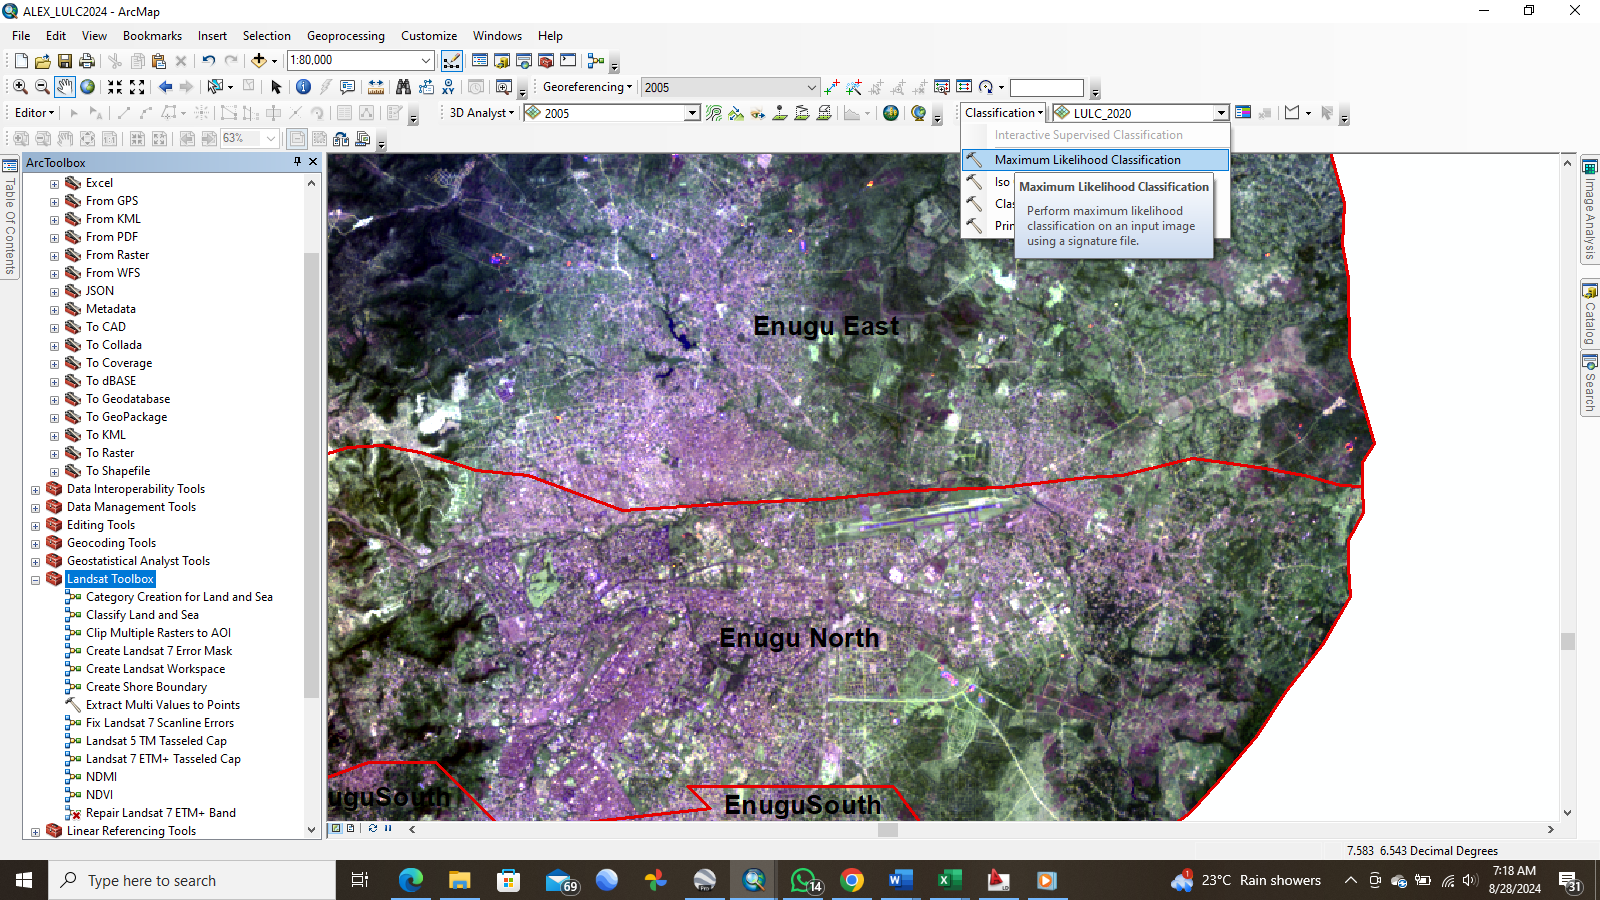
Overview: 33‑year land use/cover change detection using Landsat imagery (1990,1995,2000,2005,2010,2015,2020,2023). Supervised classification (Maximum Likelihood) in ArcGIS.
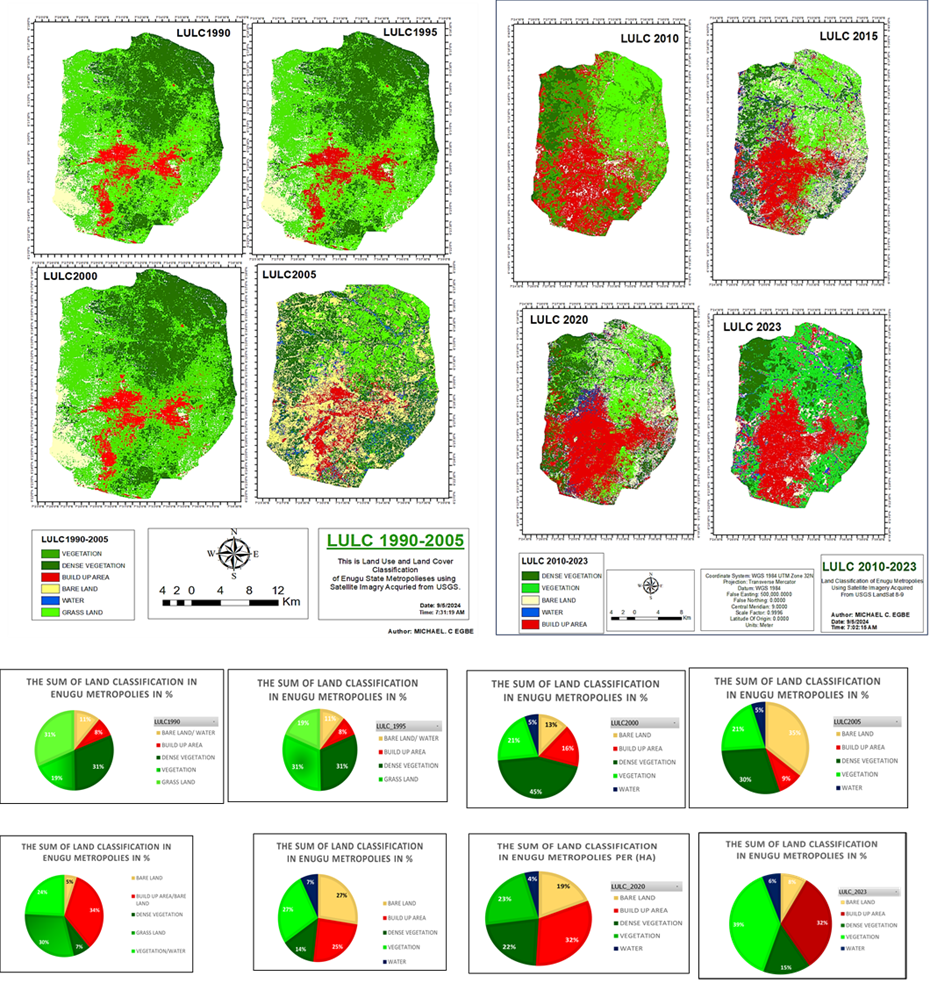
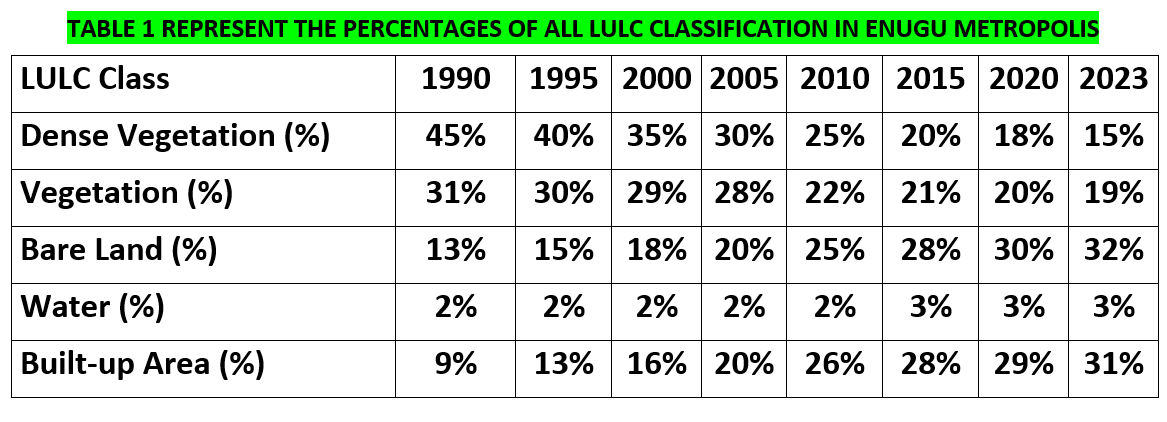
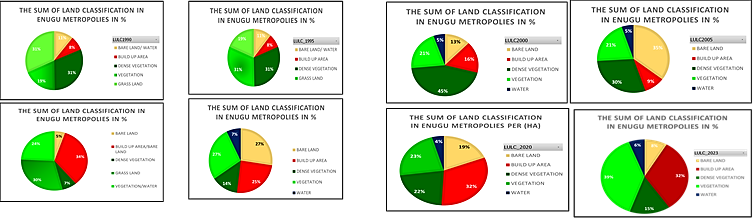
1990 Built‑up 9% · Dense veg. 45% · Veg. 31% · Bare 13%
2023 Built‑up 31% ↑ · Dense veg. 15% ↓ · Bare 32% ↑
Key findings: Rapid urban expansion, loss of vegetation. Flood risk increase in southern fringe.
Methodology: Landsat 5/7/8, atmospheric correction, confusion matrix (kappa >0.85), post‑classification comparison.
Challenges & solutions: Landsat 7 scan‑line gaps → fill with Landsat 7 toolbox; spectral confusion bare/built‑up → field verification & ancillary data.
Recommendations: green urban planning, reforestation, policy reinforcement.
Tools: ArcGIS, Landsat, Excel, Surfer. Map by Michael C. Egbe, Sept 2024.
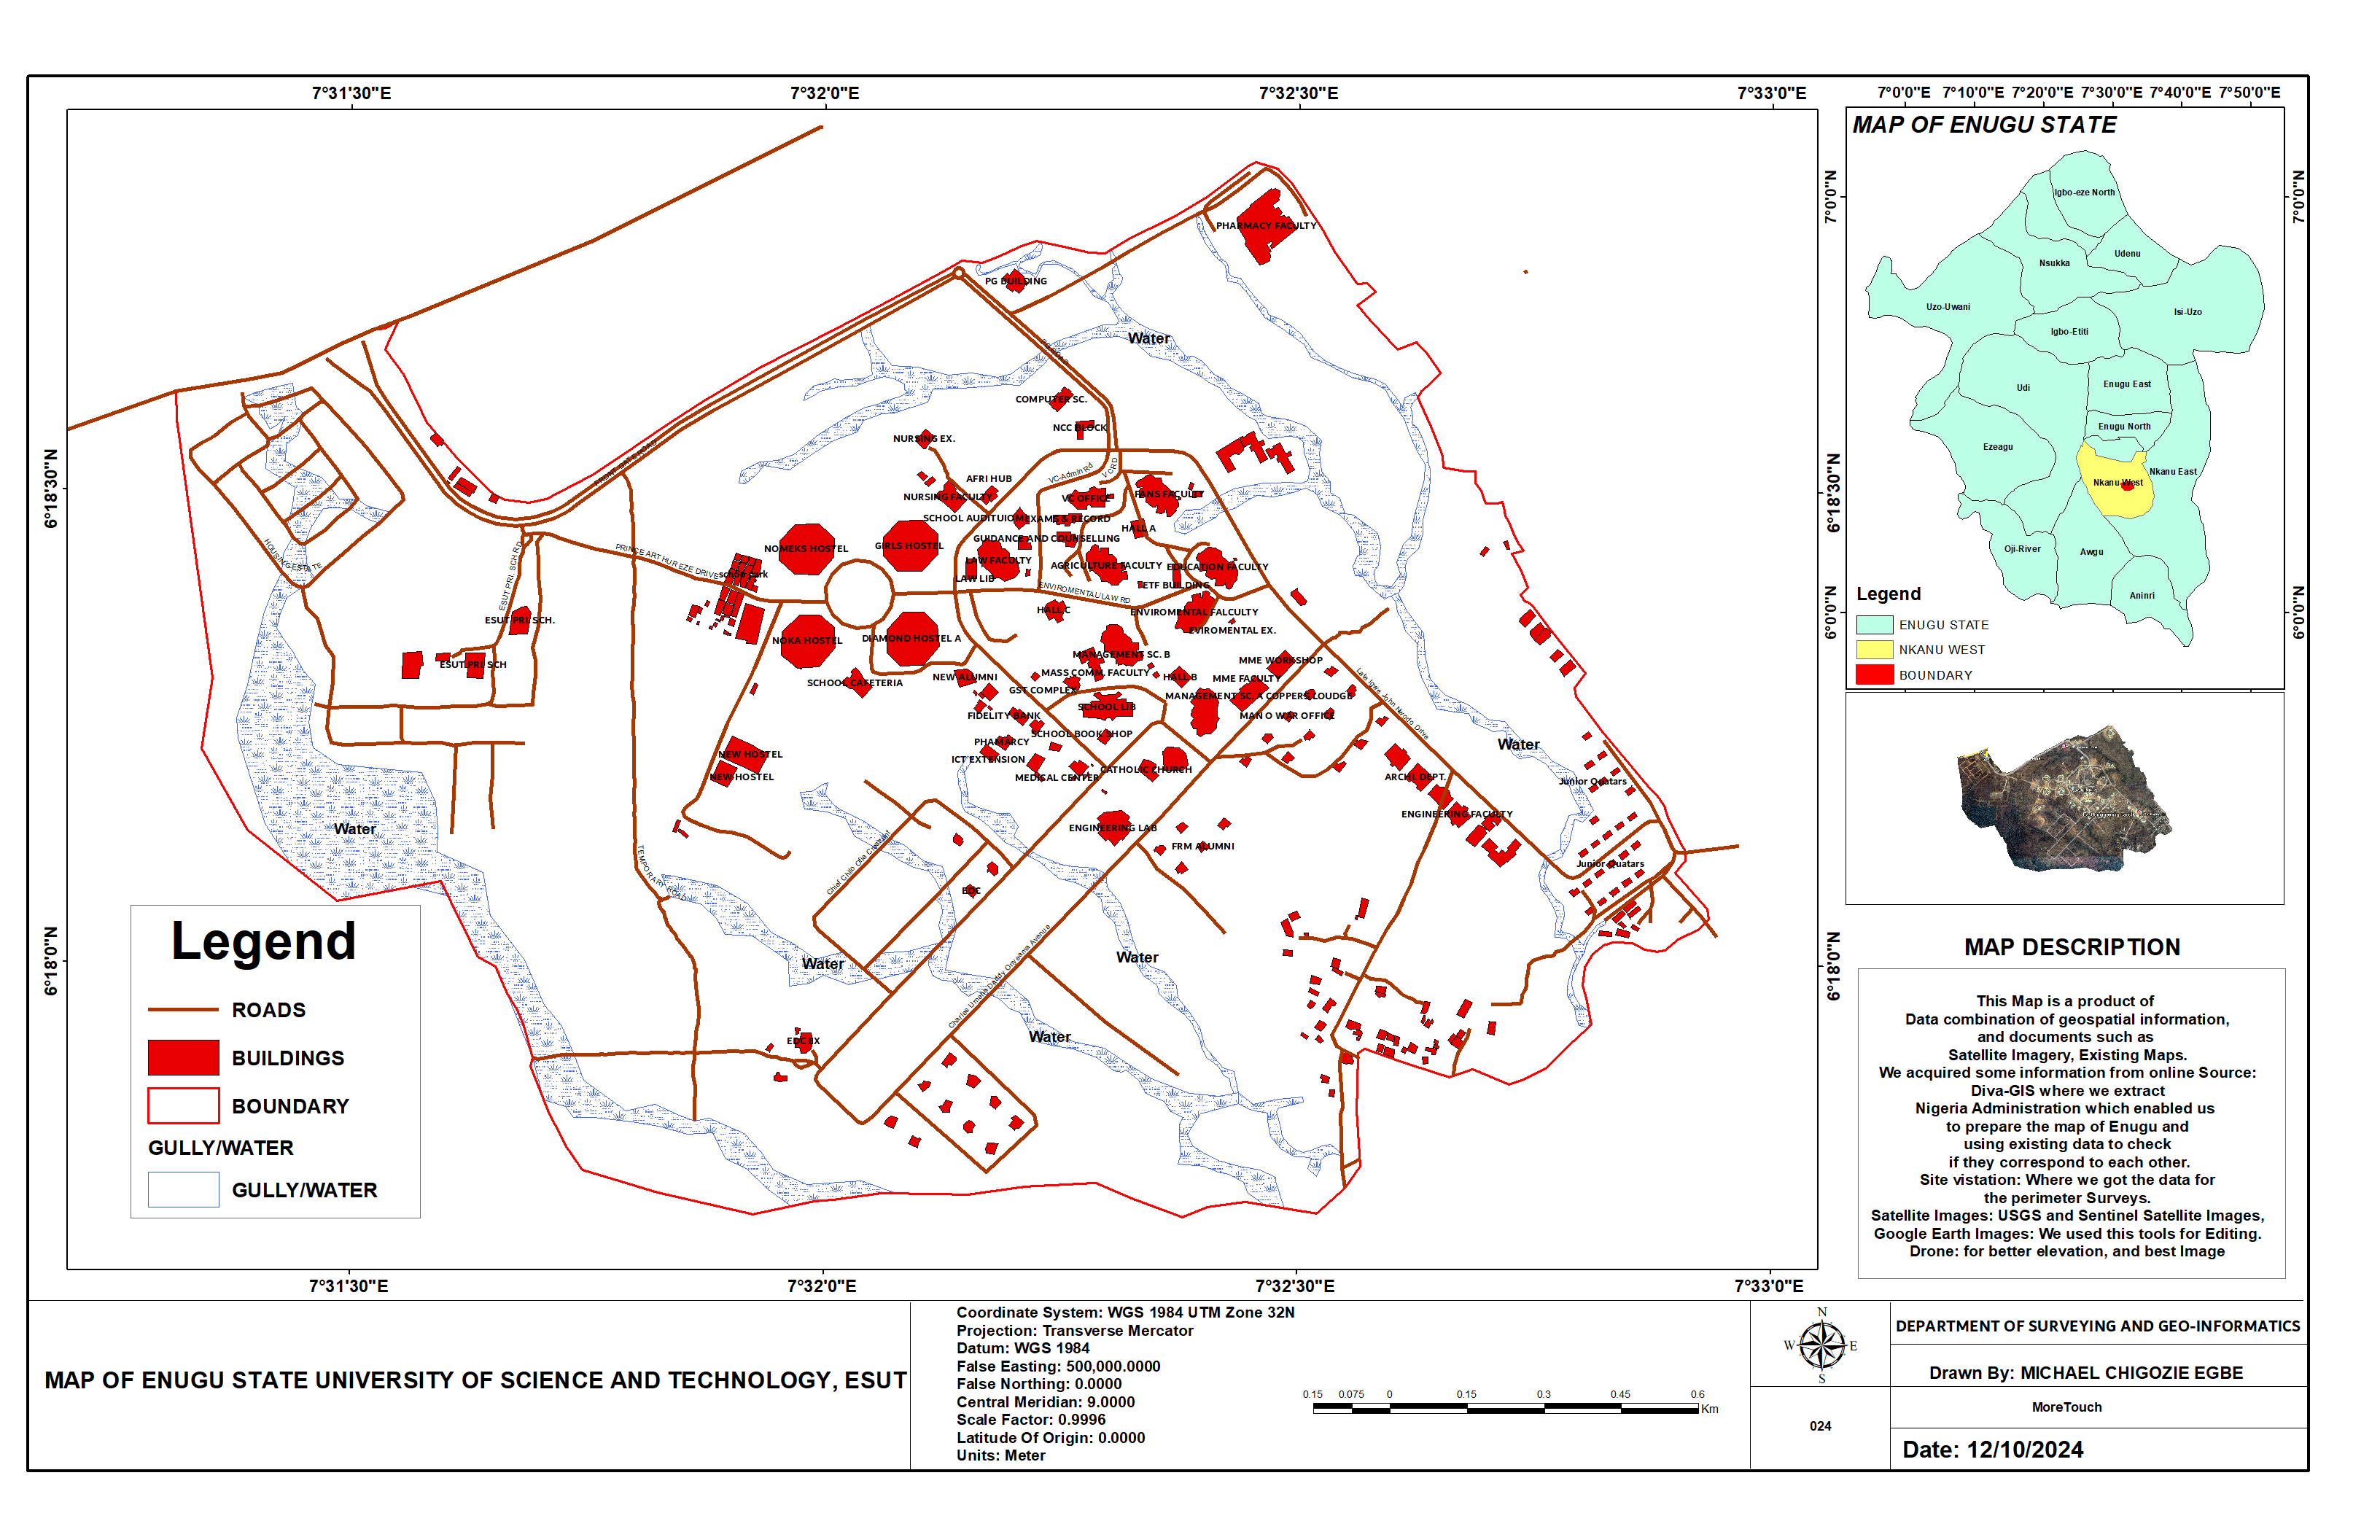
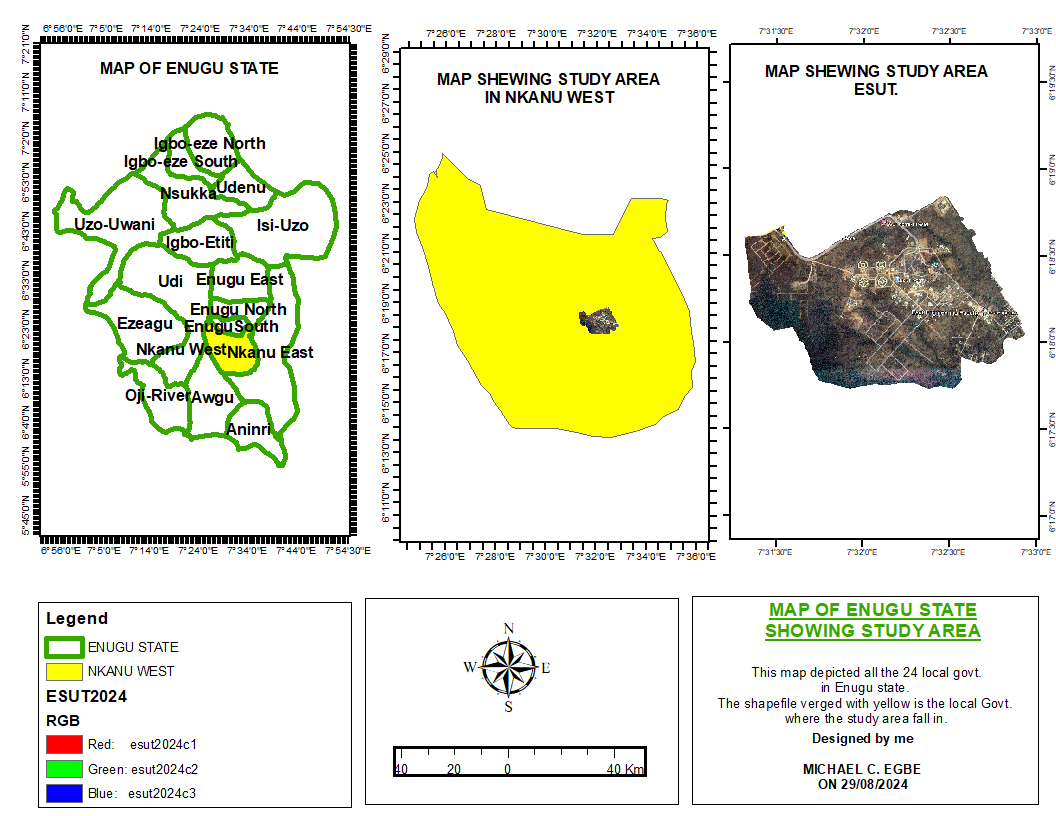
ESUT campus map (WGS84 UTM 32N) – roads (brown), buildings (red), gully/water (blue), inset of Enugu state. Data sources: USGS, Sentinel, Google Earth, drone imagery. Cartography by Michael C. Egbe, Dec 2024.
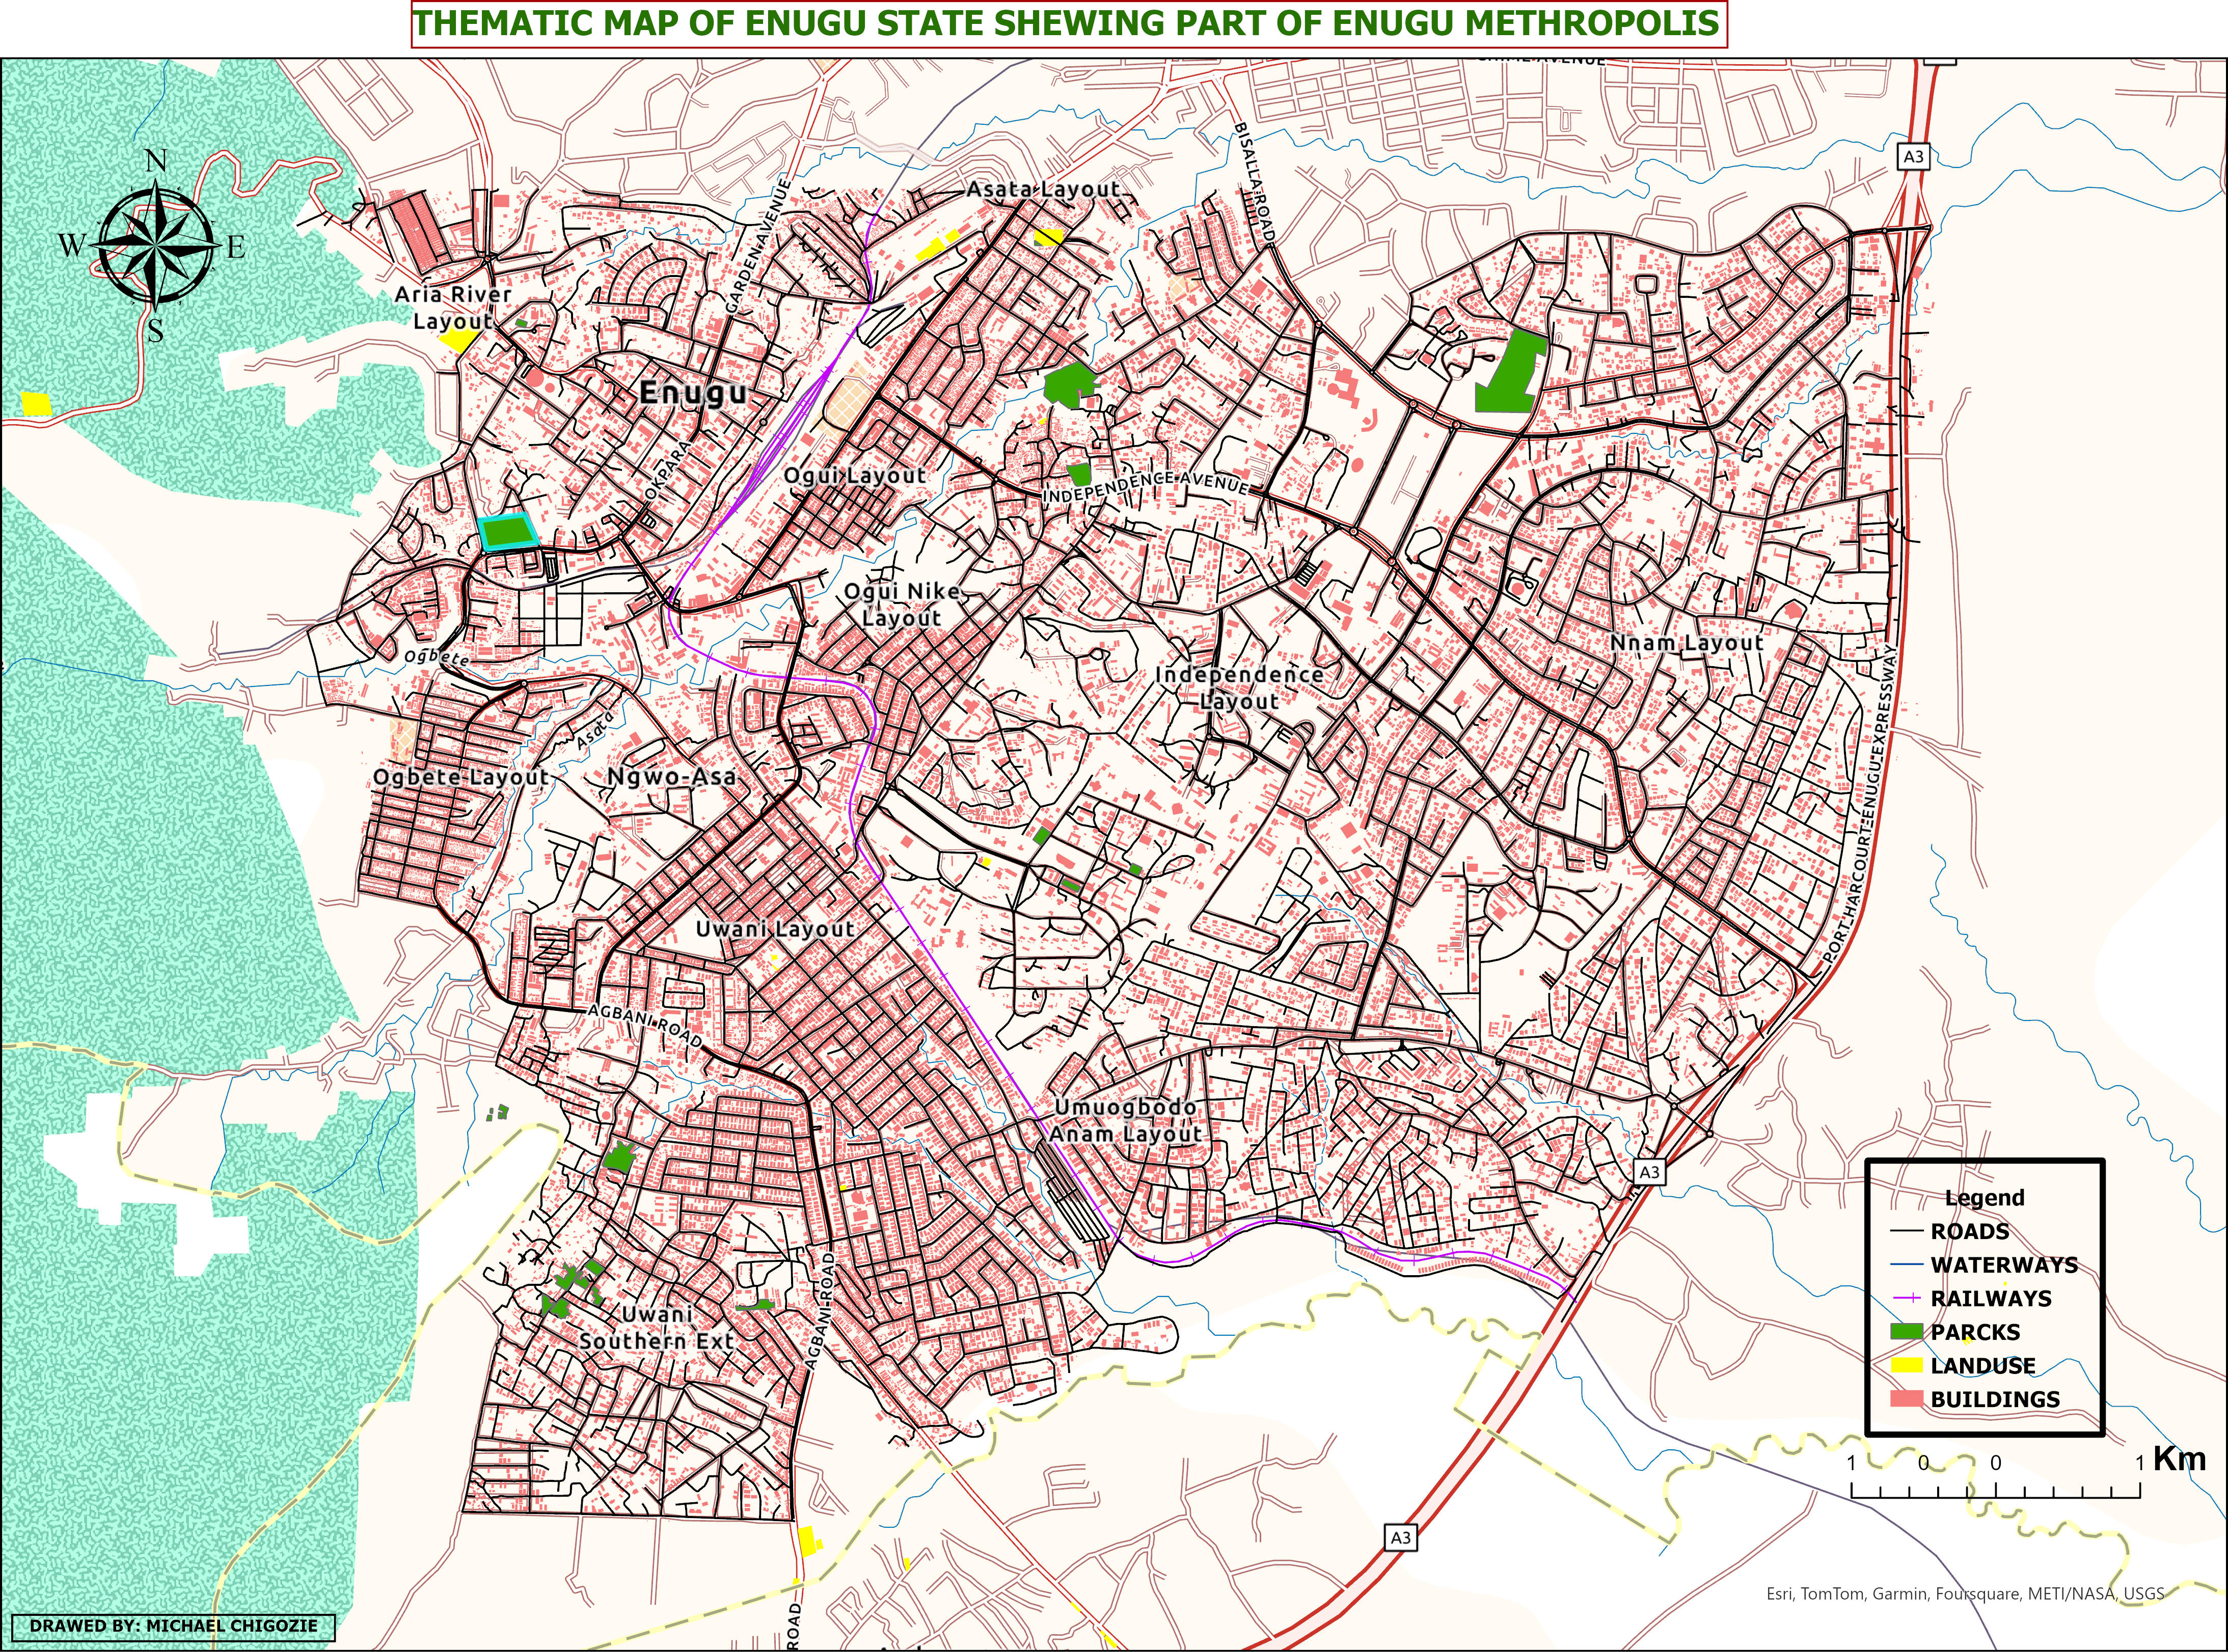
Thematic map of Enugu: land use, transport, parks, water bodies – essential for urban planning.
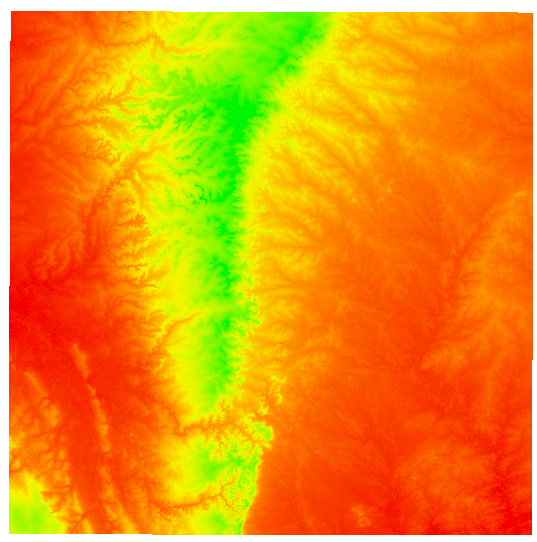
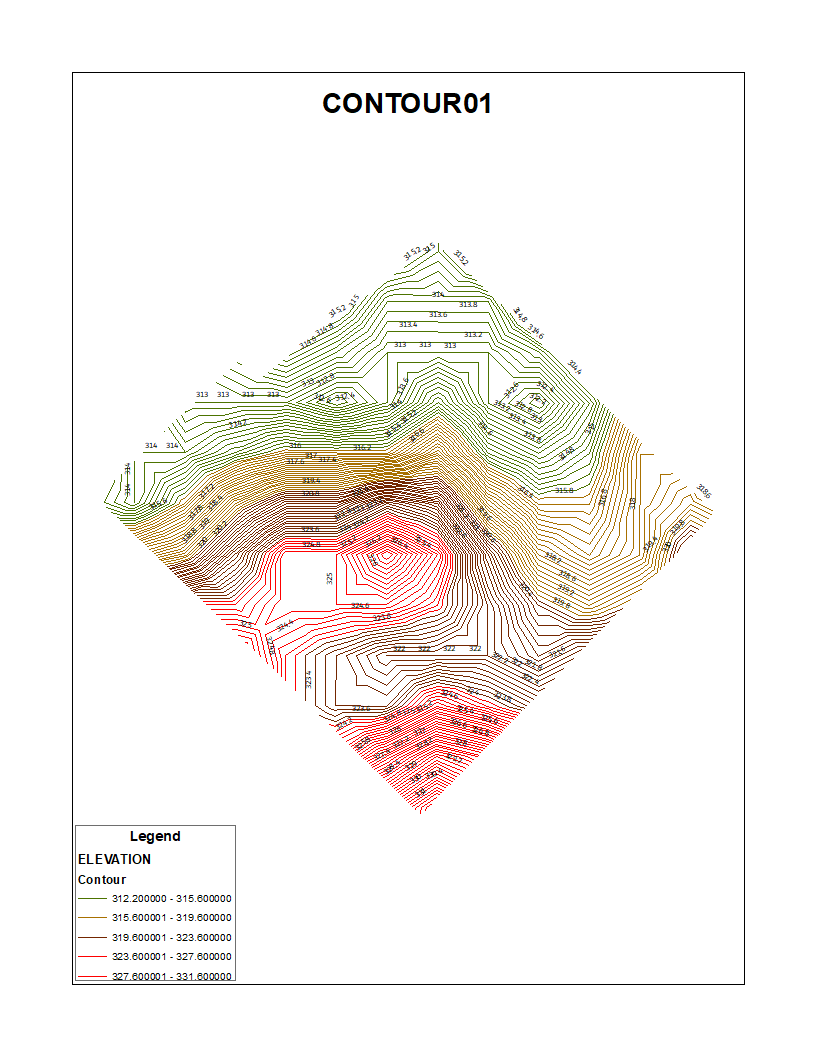
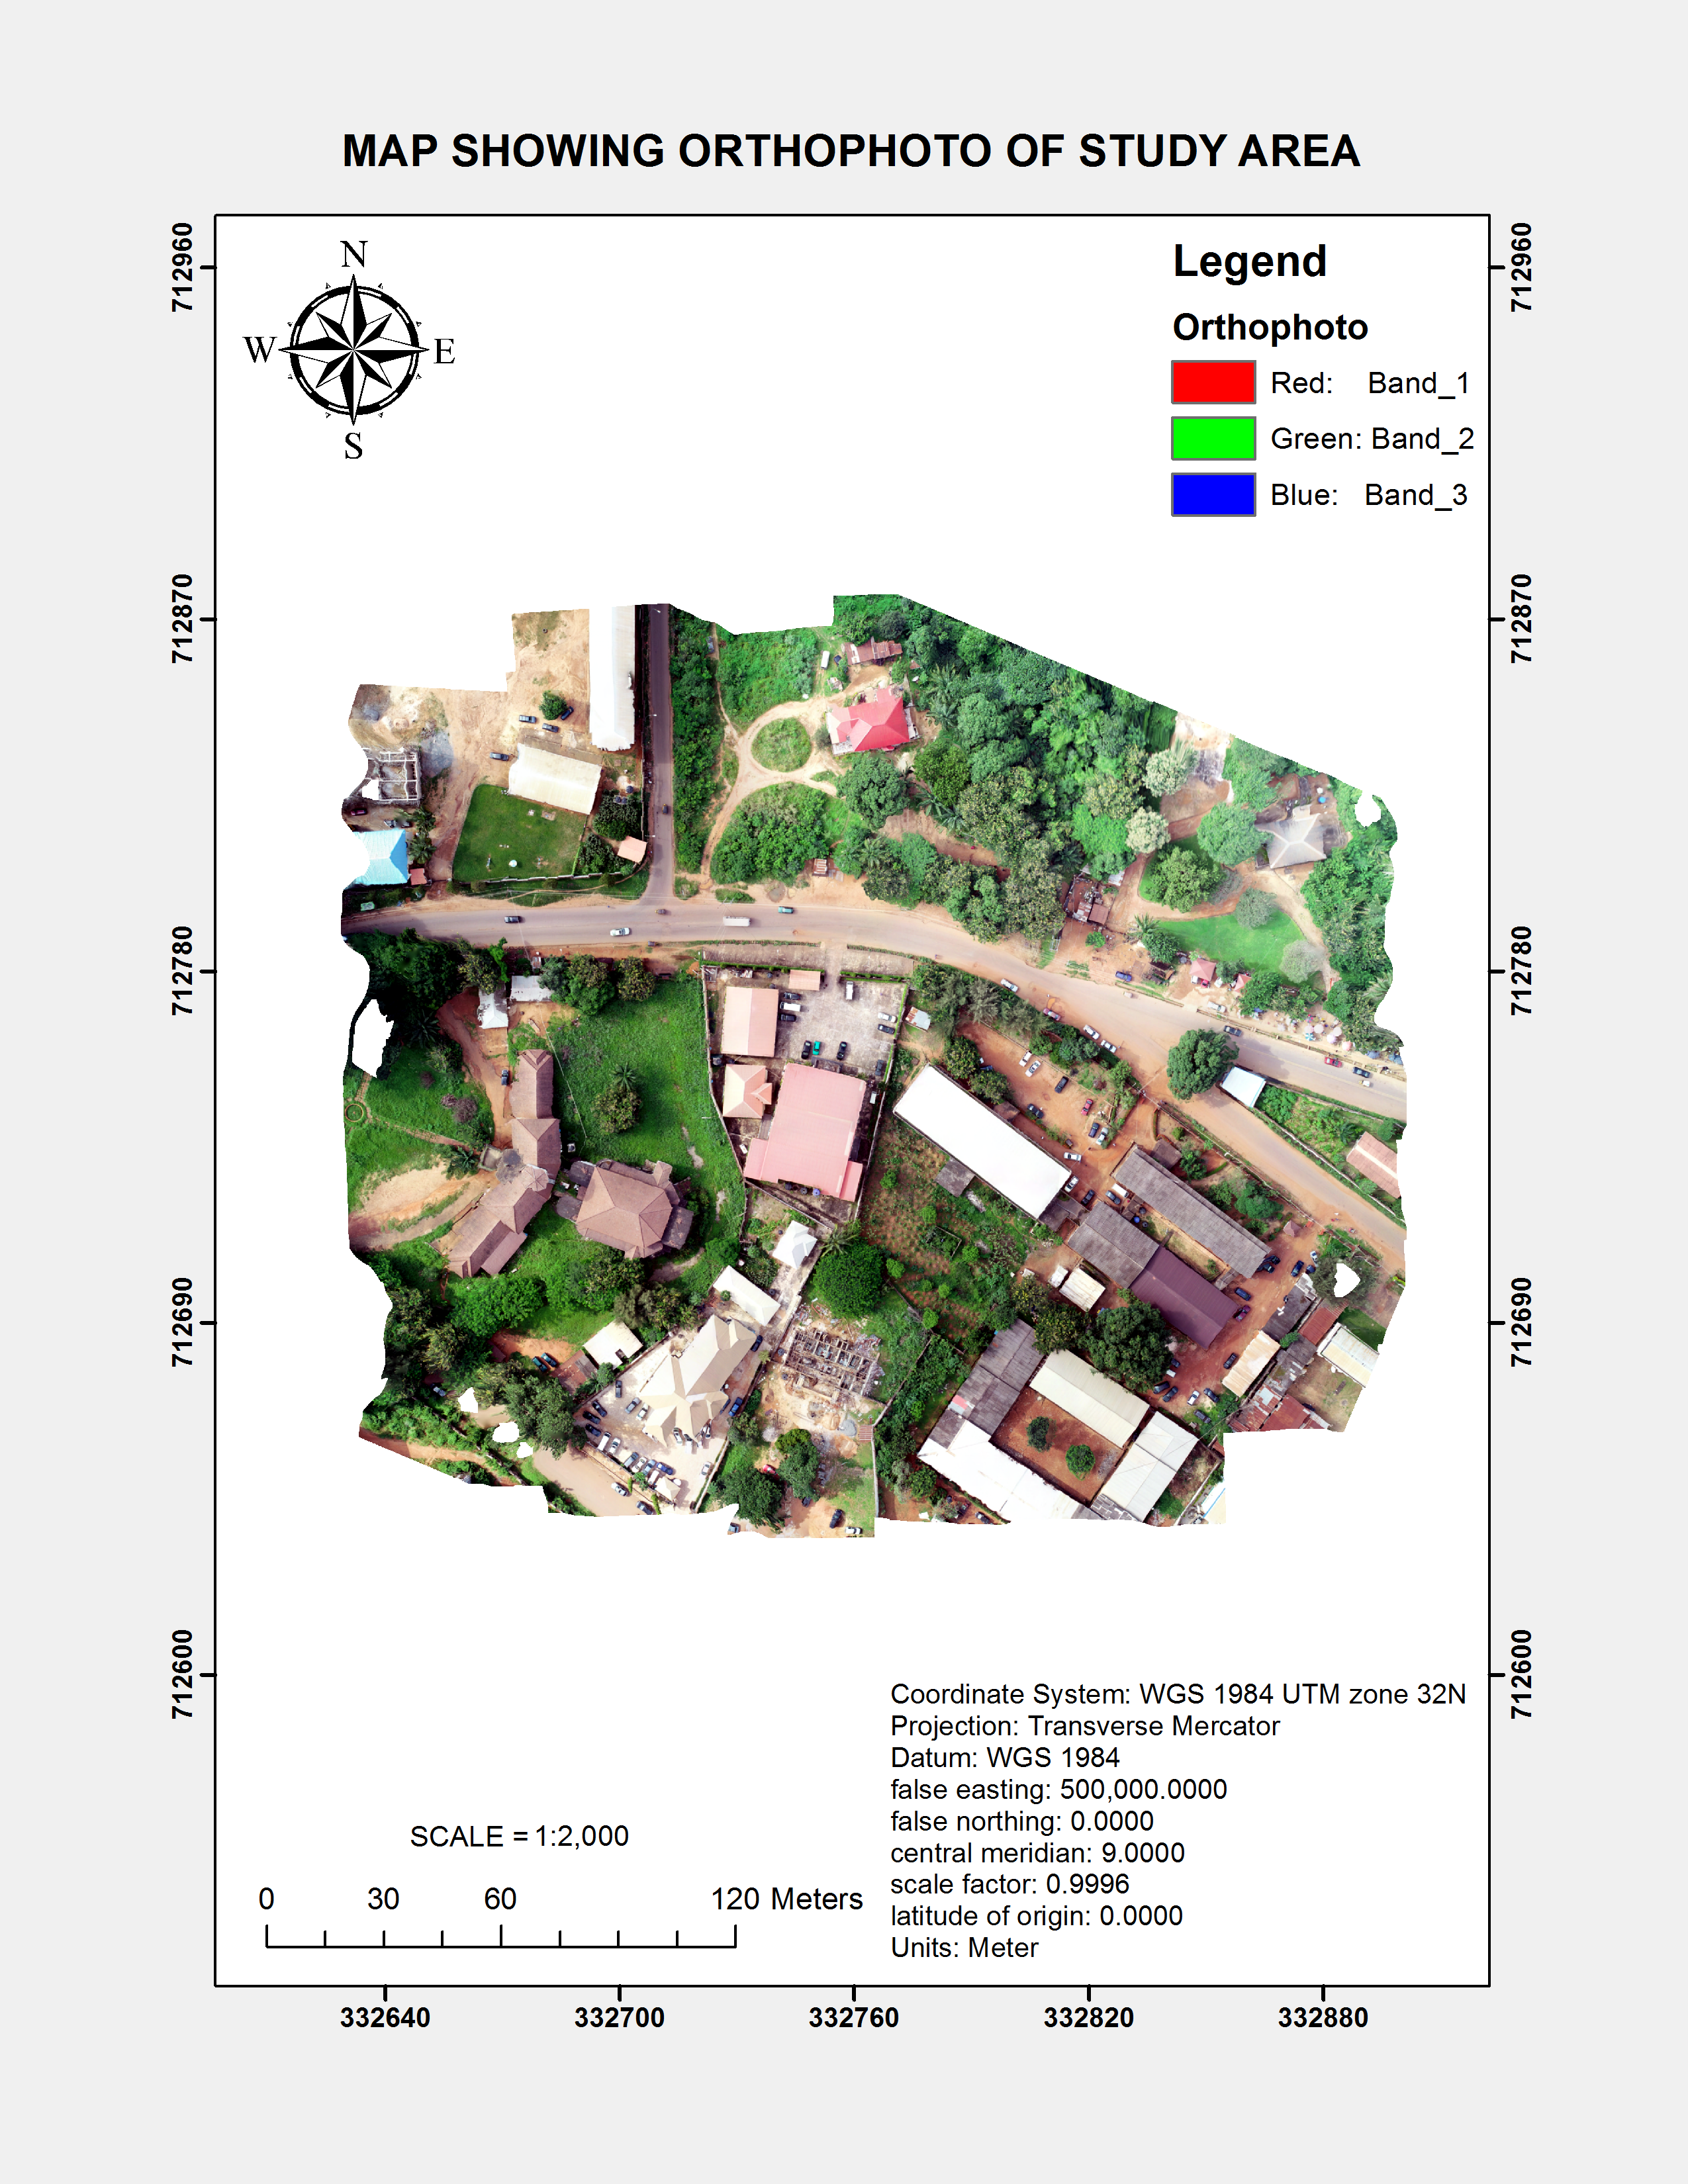
Slope, aspect, and hillshade derived from 10m DEM. Used for drainage analysis and infrastructure planning. Orthophoto generated from drone survey (5cm resolution).
Data Analysis & Visualization
Turning raw data into strategic insights with Python, Power BI, Excel. From immunization trends to food price heatmaps.
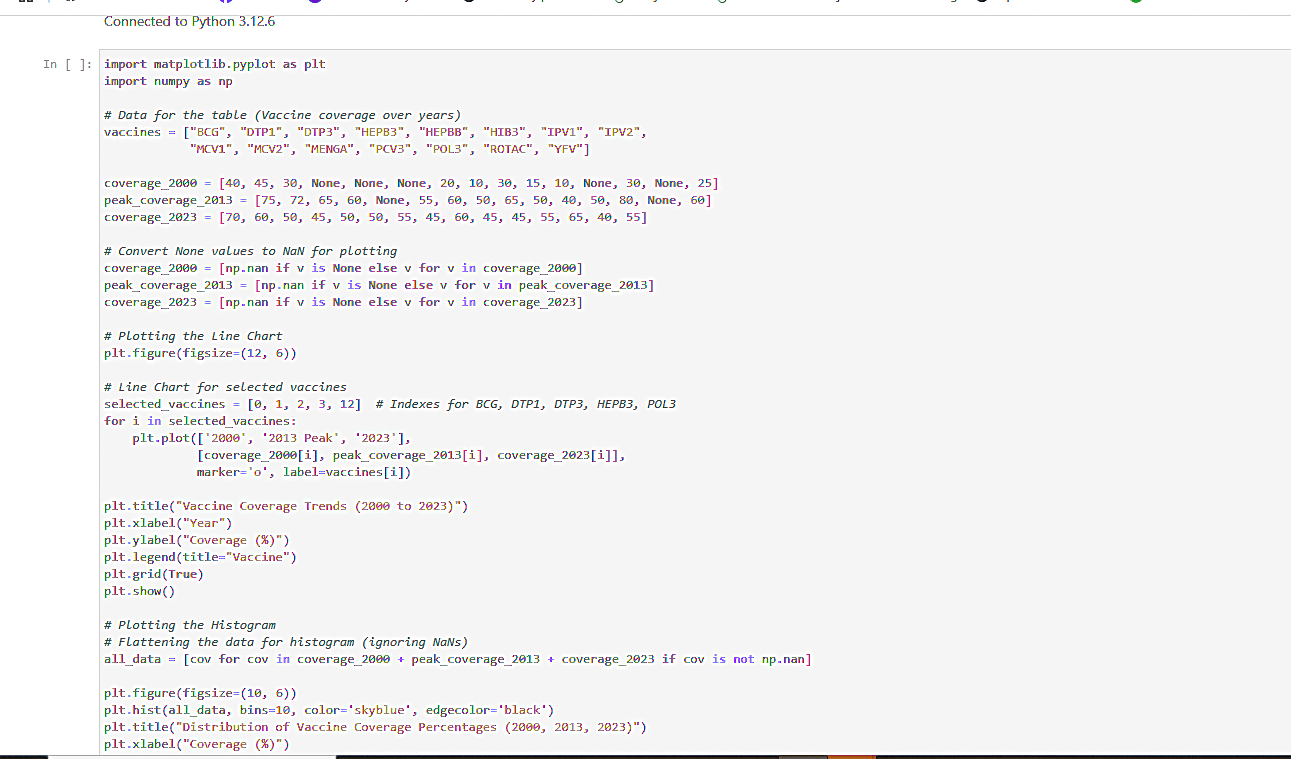
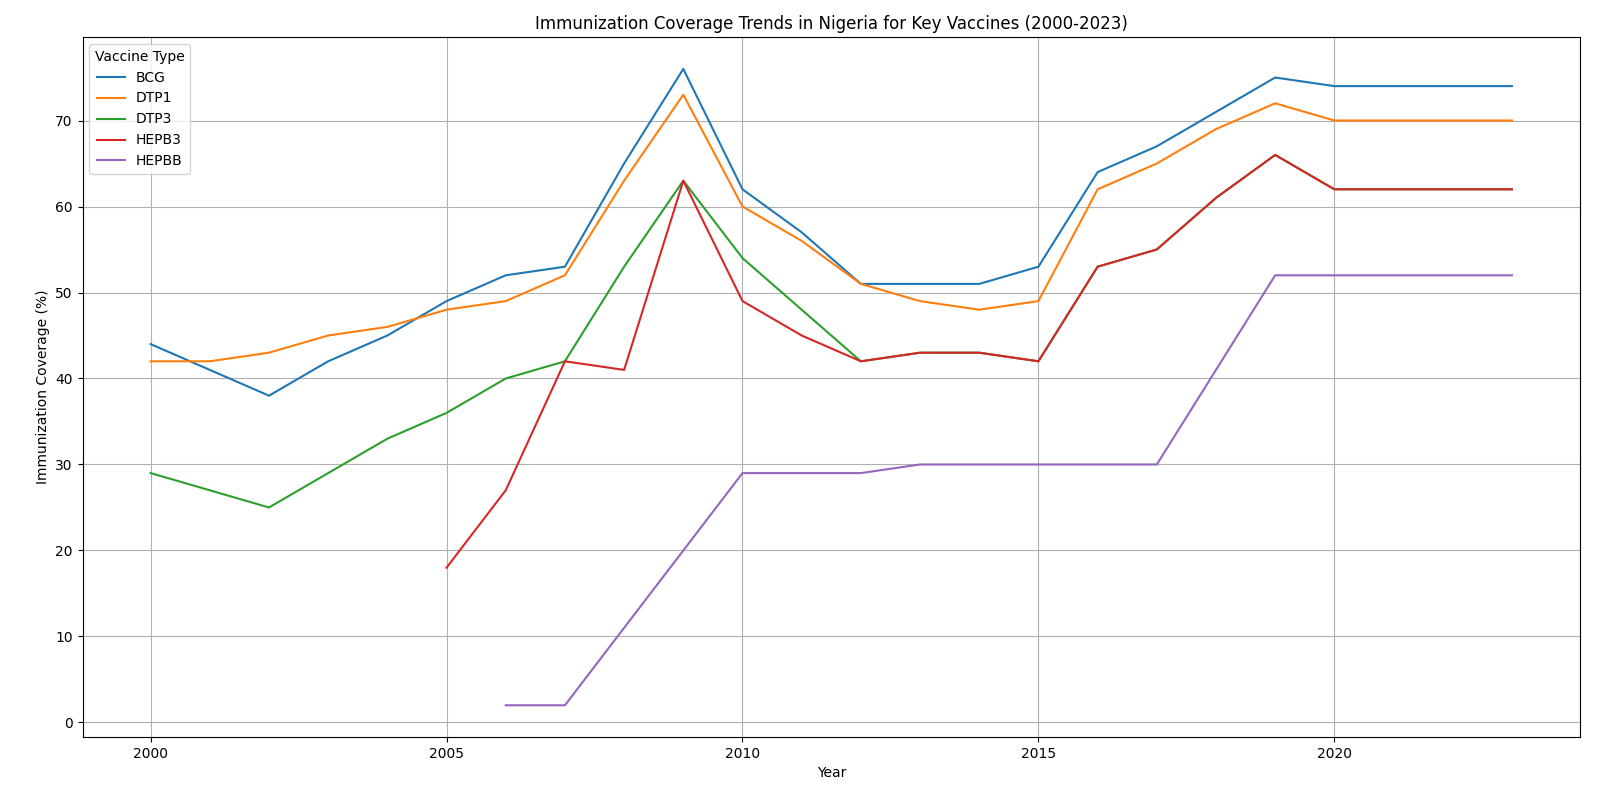
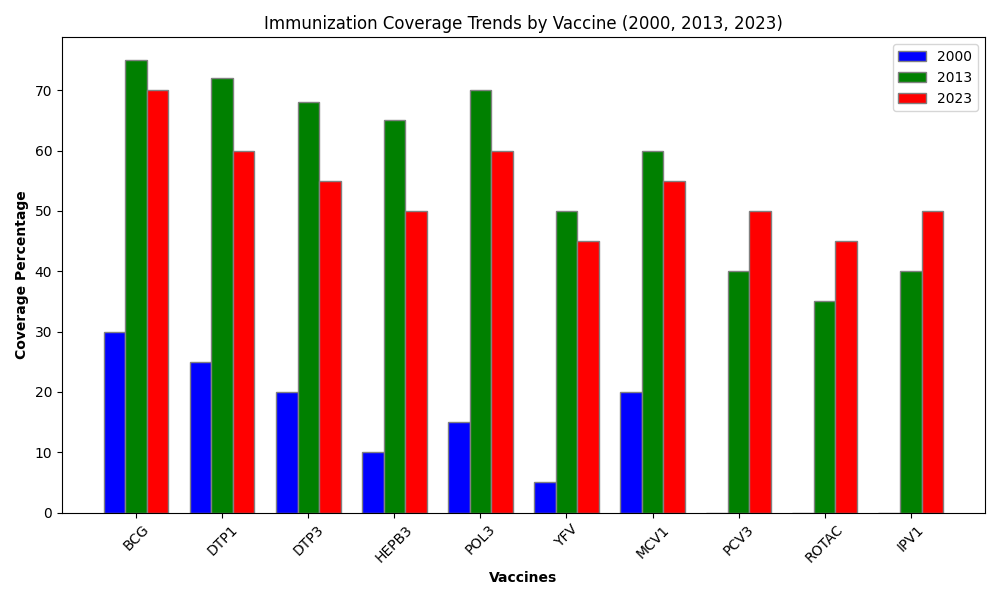
Vaccines: BCG, DTP1/3, HEPB3, POL3, YFV, MCV1, PCV3, ROTAC, IPV1.
2000 low coverage (blue bars) · 2013 increase (green) · 2023 high/stabilised (red).
BCG & DTP1 consistently high; DTP3, POL3, HEPB3 improved significantly after 2013. PCV3, ROTAC introduced later, now >70%.

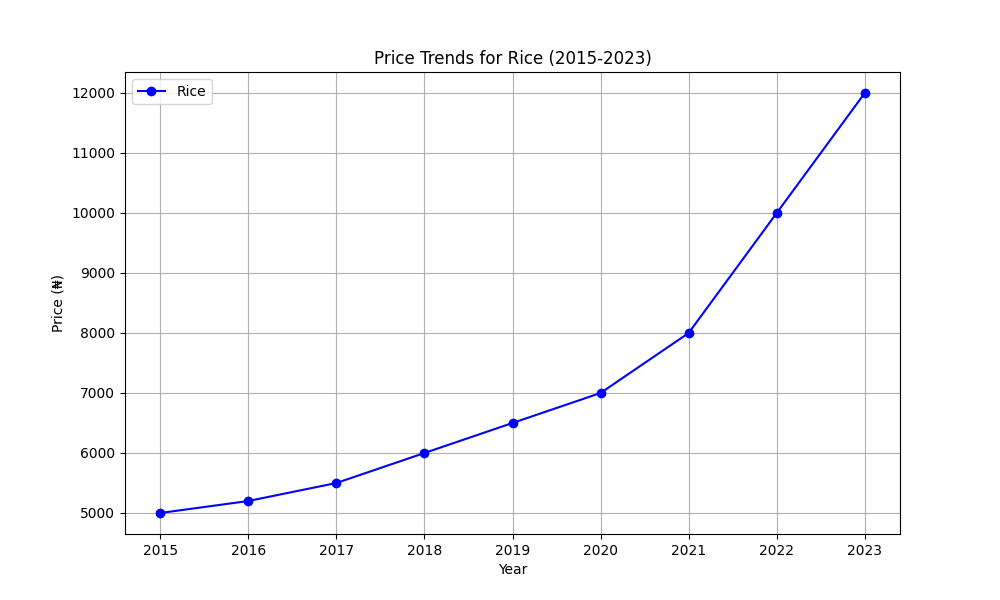
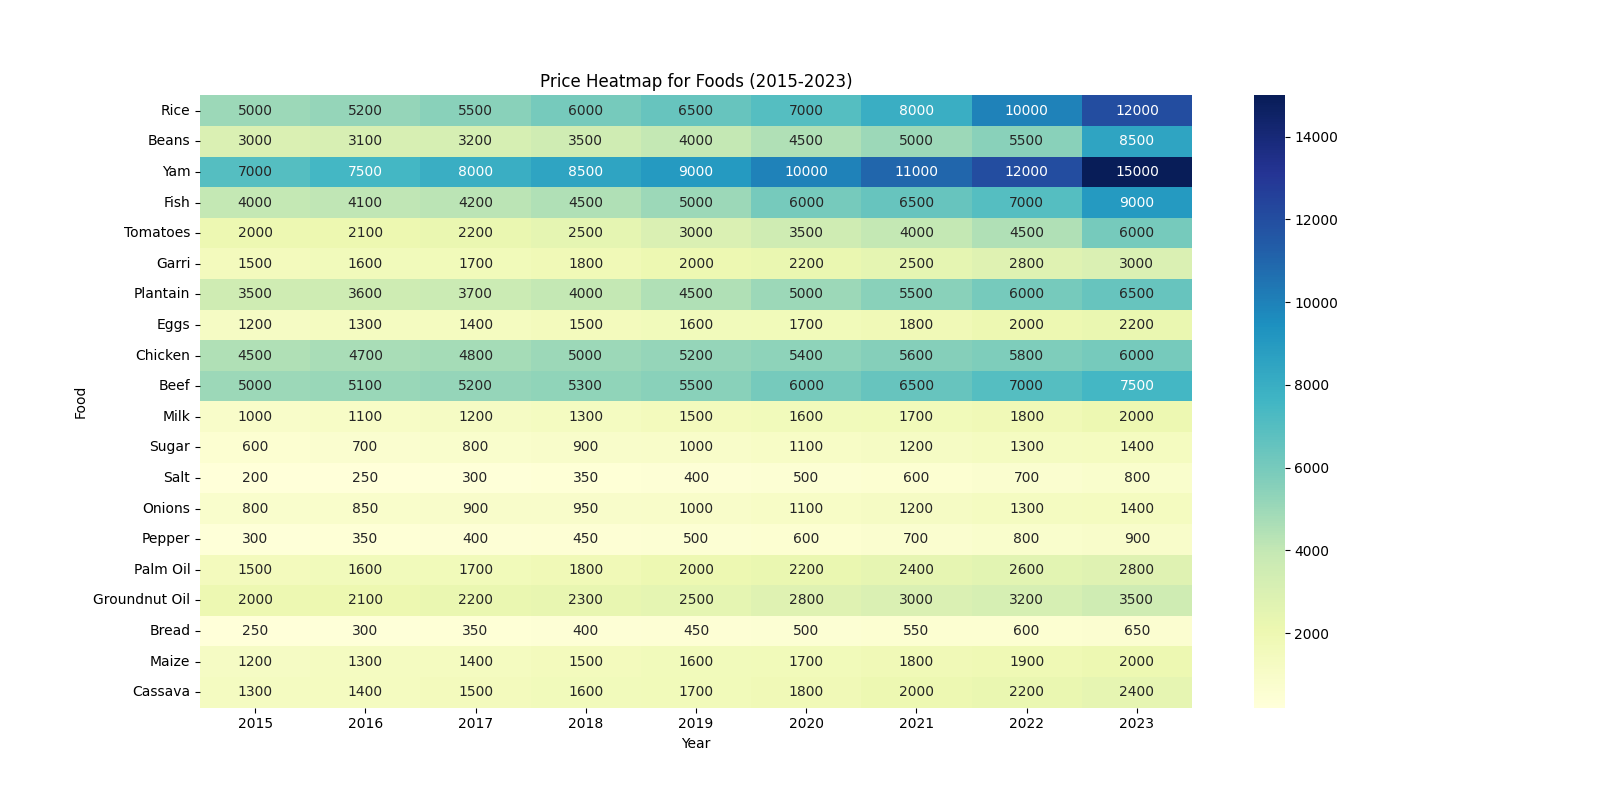
Heatmap interpretation: darker red = higher average price. Northern states show lower prices for grains, while southern urban areas have steeper costs. Analysis with pandas & seaborn.
Data aggregated from NBS and market surveys. Used for inflation impact assessment.
Custom analytical services
Academic research support
Literature review, spatial data acquisition, field work assistance, and report writing – especially environment, urban planning, and development studies.
Fraud detection & market analytics
Geospatial and statistical modelling for business intelligence, resource management, and risk analysis.