MIKE PORTFOLIO

Surveying Β· GIS & Remote Sensing Β· Data Analysis

Michael C. Egbe

HELLO, I'M MICHAEL C.

Surveyor | GIS/Remote Sensing Analyst | Data Analyst

B.Sc. in Surveying and Geoinformatics from Enugu State University of Science and Technology. Certified by University of Toronto (Coursera) in Spatial Analysis & Satellite Imagery and Intro to Data Science.

Active volunteer with OpenStreetMap, NASA GLOBE Observer, and citizen science initiatives. I transform complex geospatial data into actionable intelligence for urban planning, environmental monitoring, and sustainable development.

πŸ“ I work Globally β€” available for remote & onsite collaboration.

Core Expertise

Precision analytics for the physical world

GIS & Remote Sensing

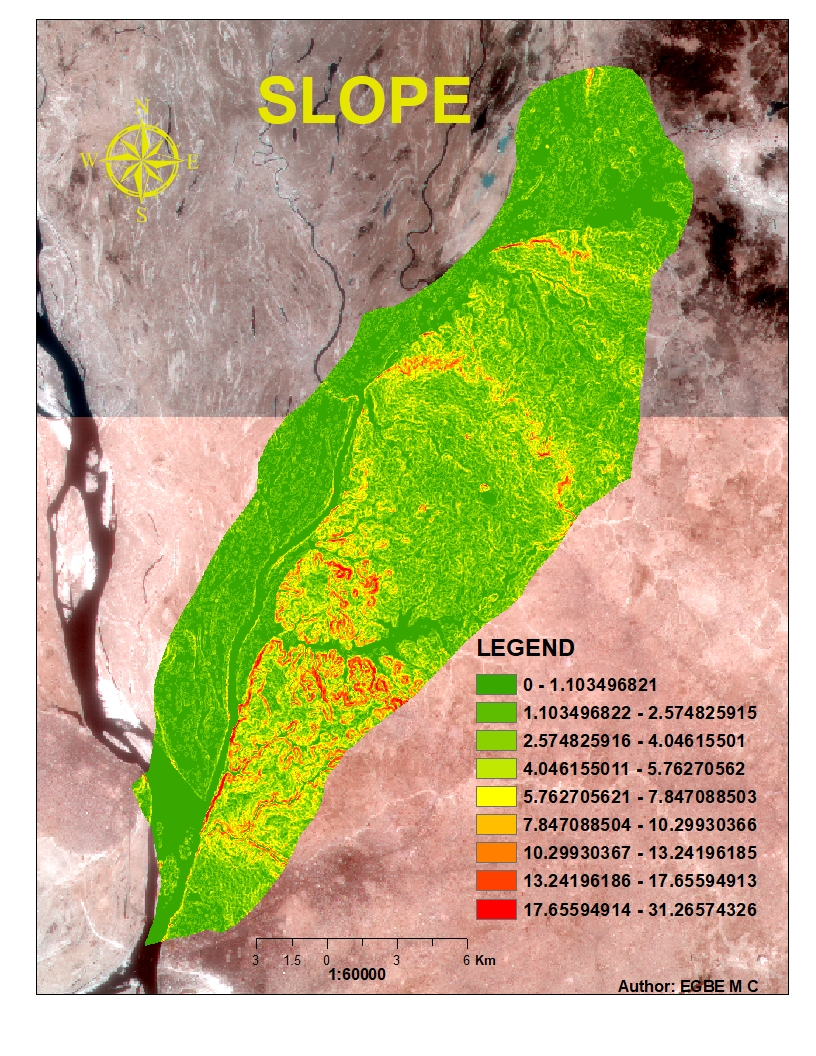
LULC mapping, terrain analysis, NDWI, TWI, satellite image classification (MLC), change detection.
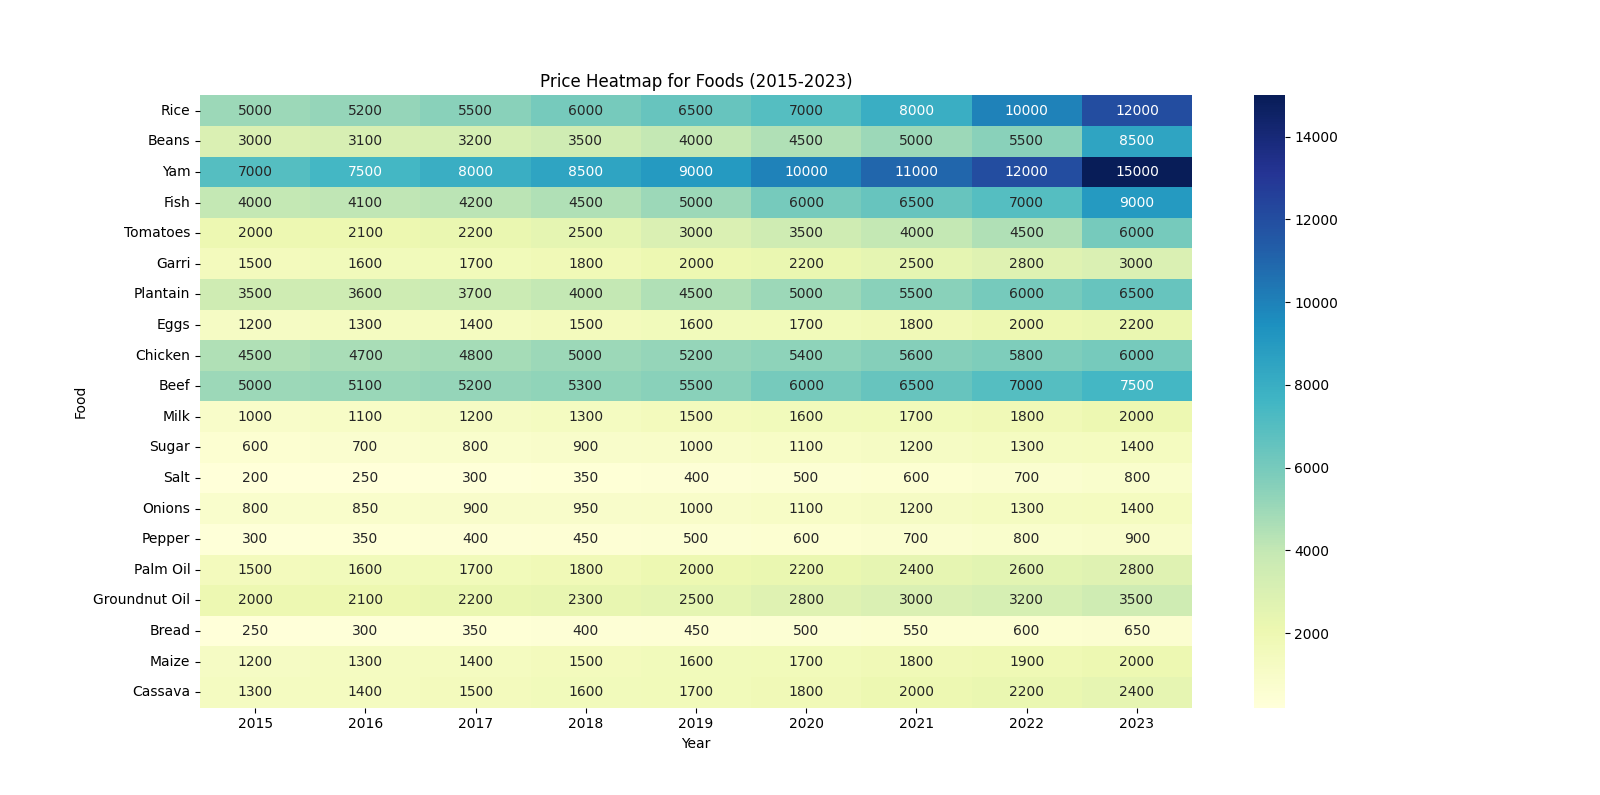
Learn more

Data Analysis

Python (pandas, matplotlib), Power BI, Excel. Trend analysis, correlation, predictive modeling.

Learn more

Academic Research

Literature review, fieldwork, spatial data acquisition, and report writing for environmental studies.

Learn more

Project Management

Milestone planning, resource allocation, task tracking β€” from survey design to final delivery.

Learn more
β†’ View all services & case studies ←

Recent Projects

Click on any image to read the story behind it

LULC Enugu

LULC Enugu Metropolis 1990-2005

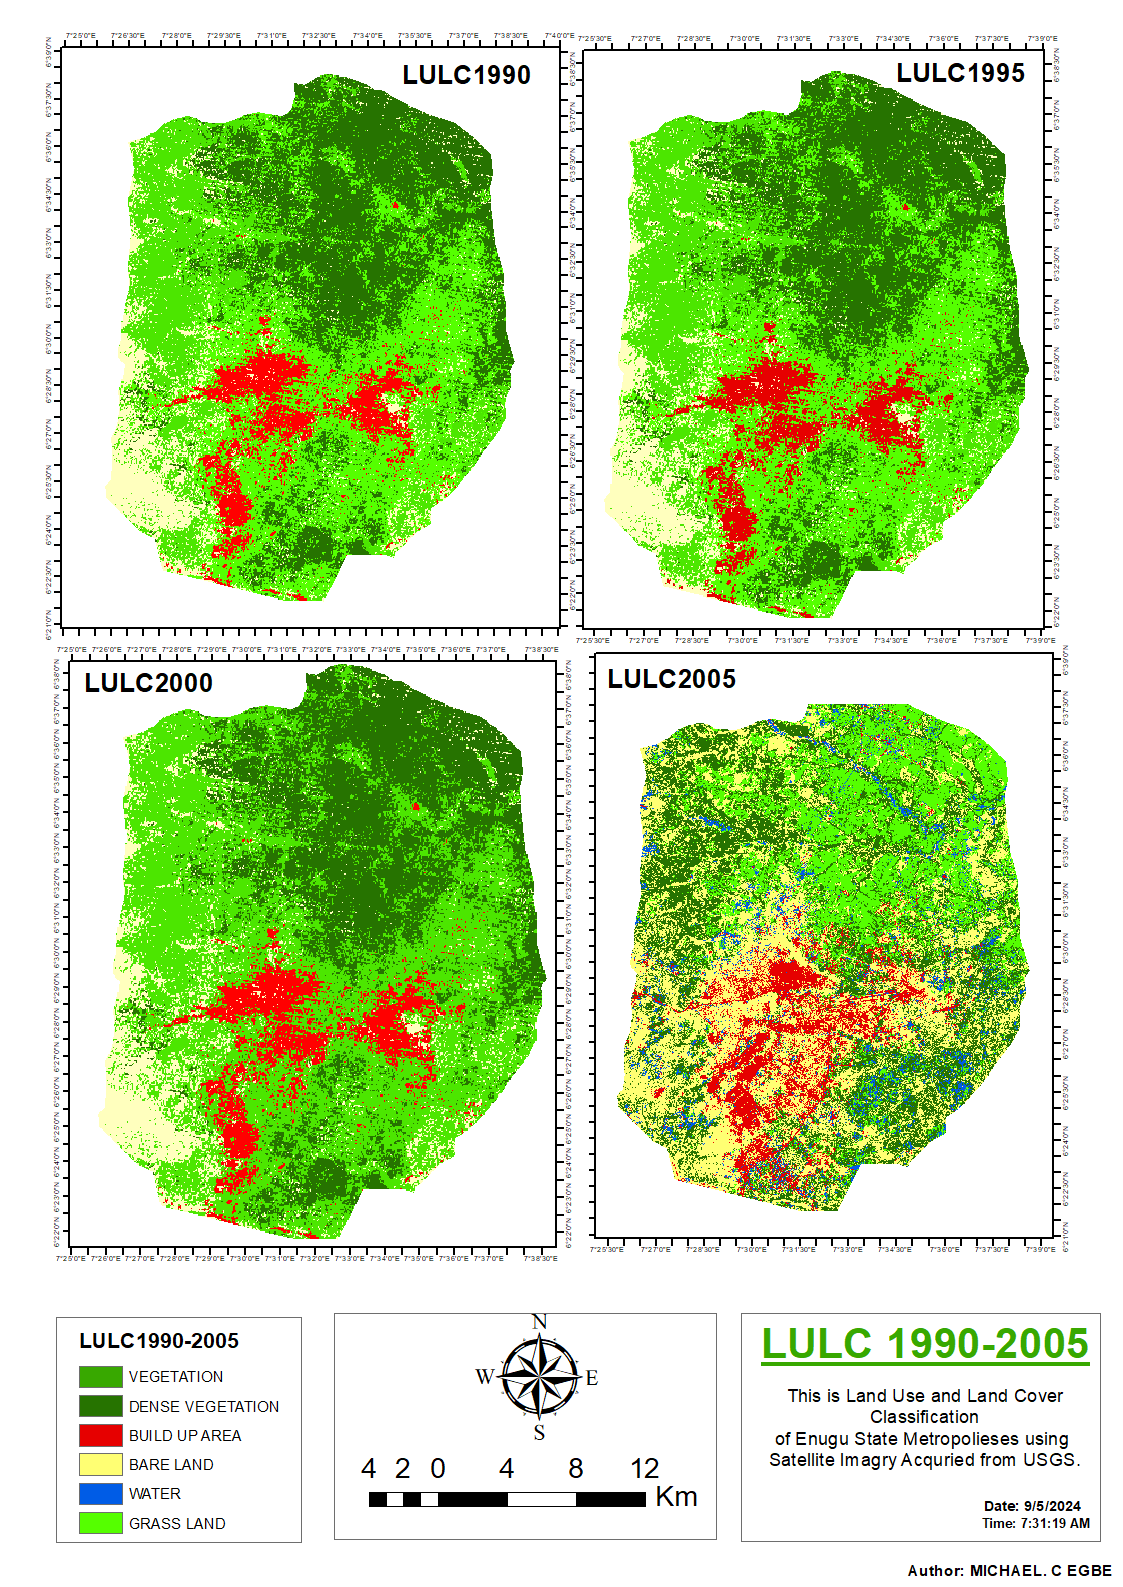
Land use/cover change

Categories: Vegetation, built-up, bare land, water.
Built-up increased from 9% (1990) to 31% (2023). Dense vegetation declined from 45% to 15%. Data source: Landsat (USGS).
NDWI Anambra West

NDWI – Anambra West

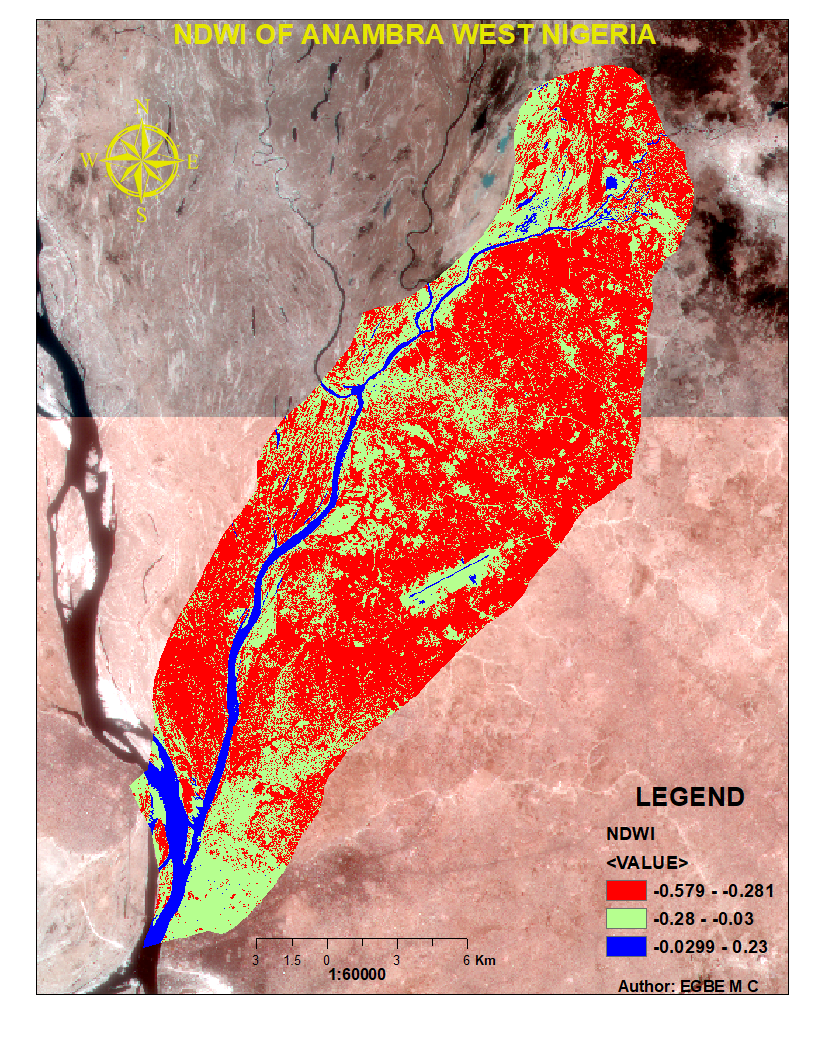
Water index analysis

Normalized Difference Water Index highlights surface water bodies. Essential for flood risk mapping and water resource management.
AQI Texas

PM & AQI Texas 2023

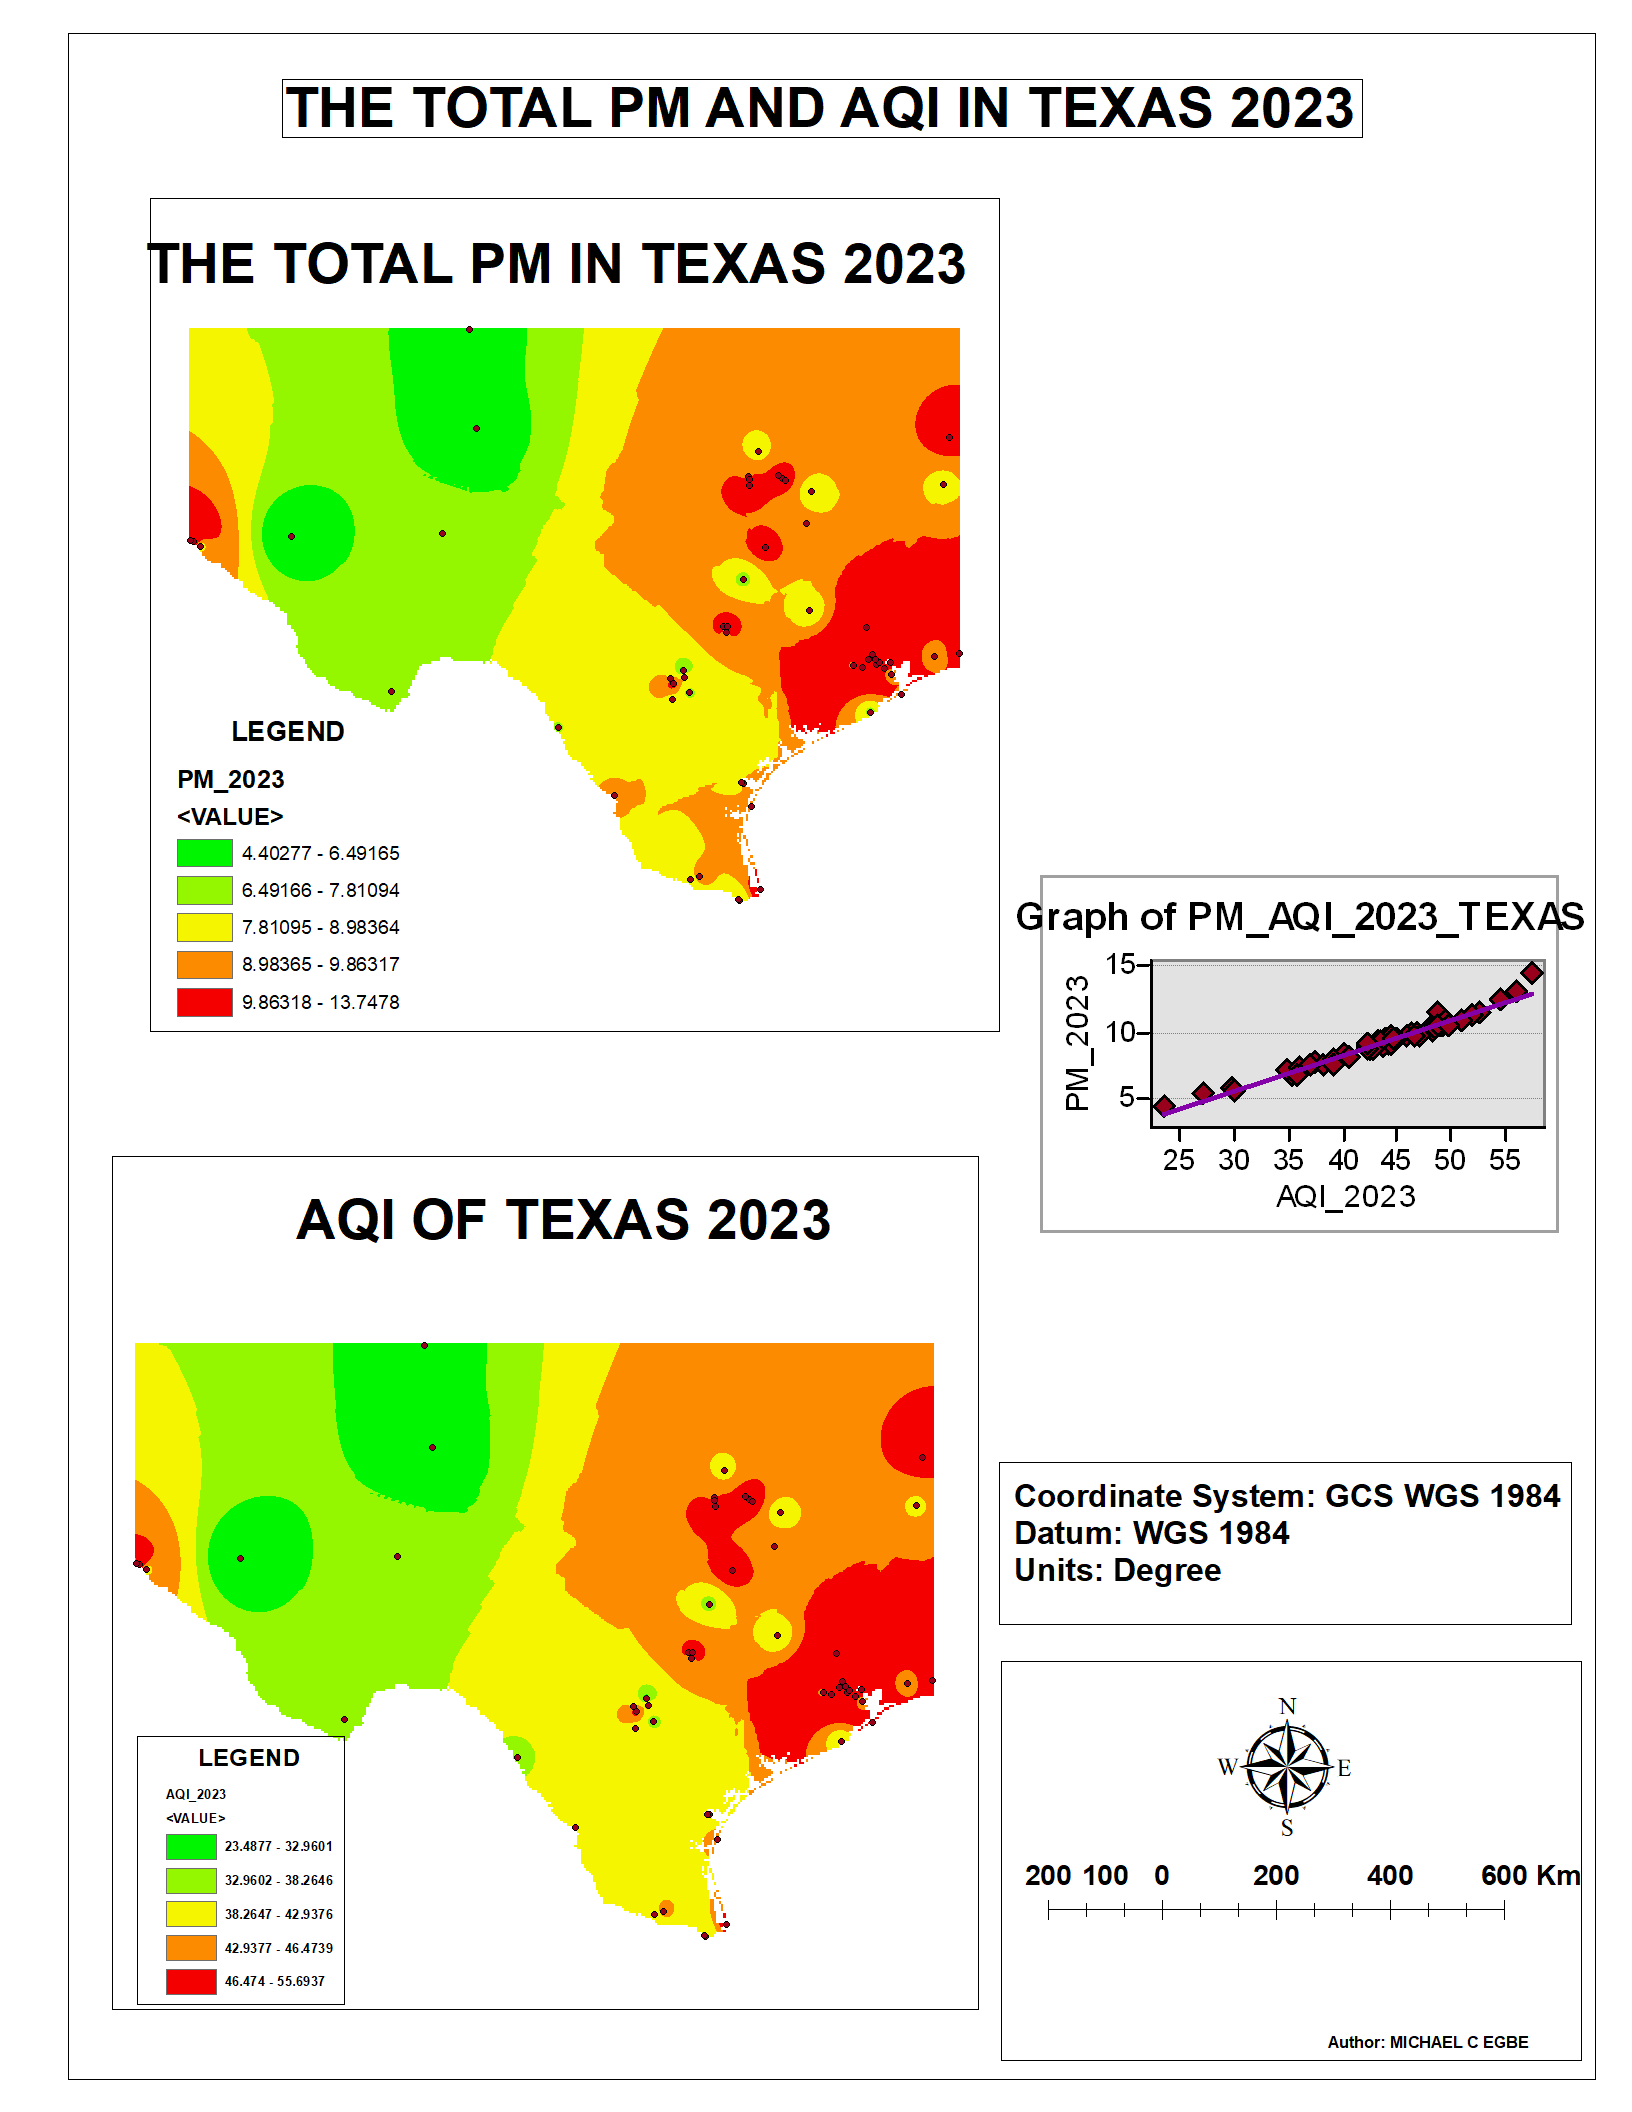
Air quality correlation

Positive correlation between PM2.5 and AQI. Western Texas shows better air quality; eastern urban clusters have higher PM.
Point cloud

Point Cloud – Study Area

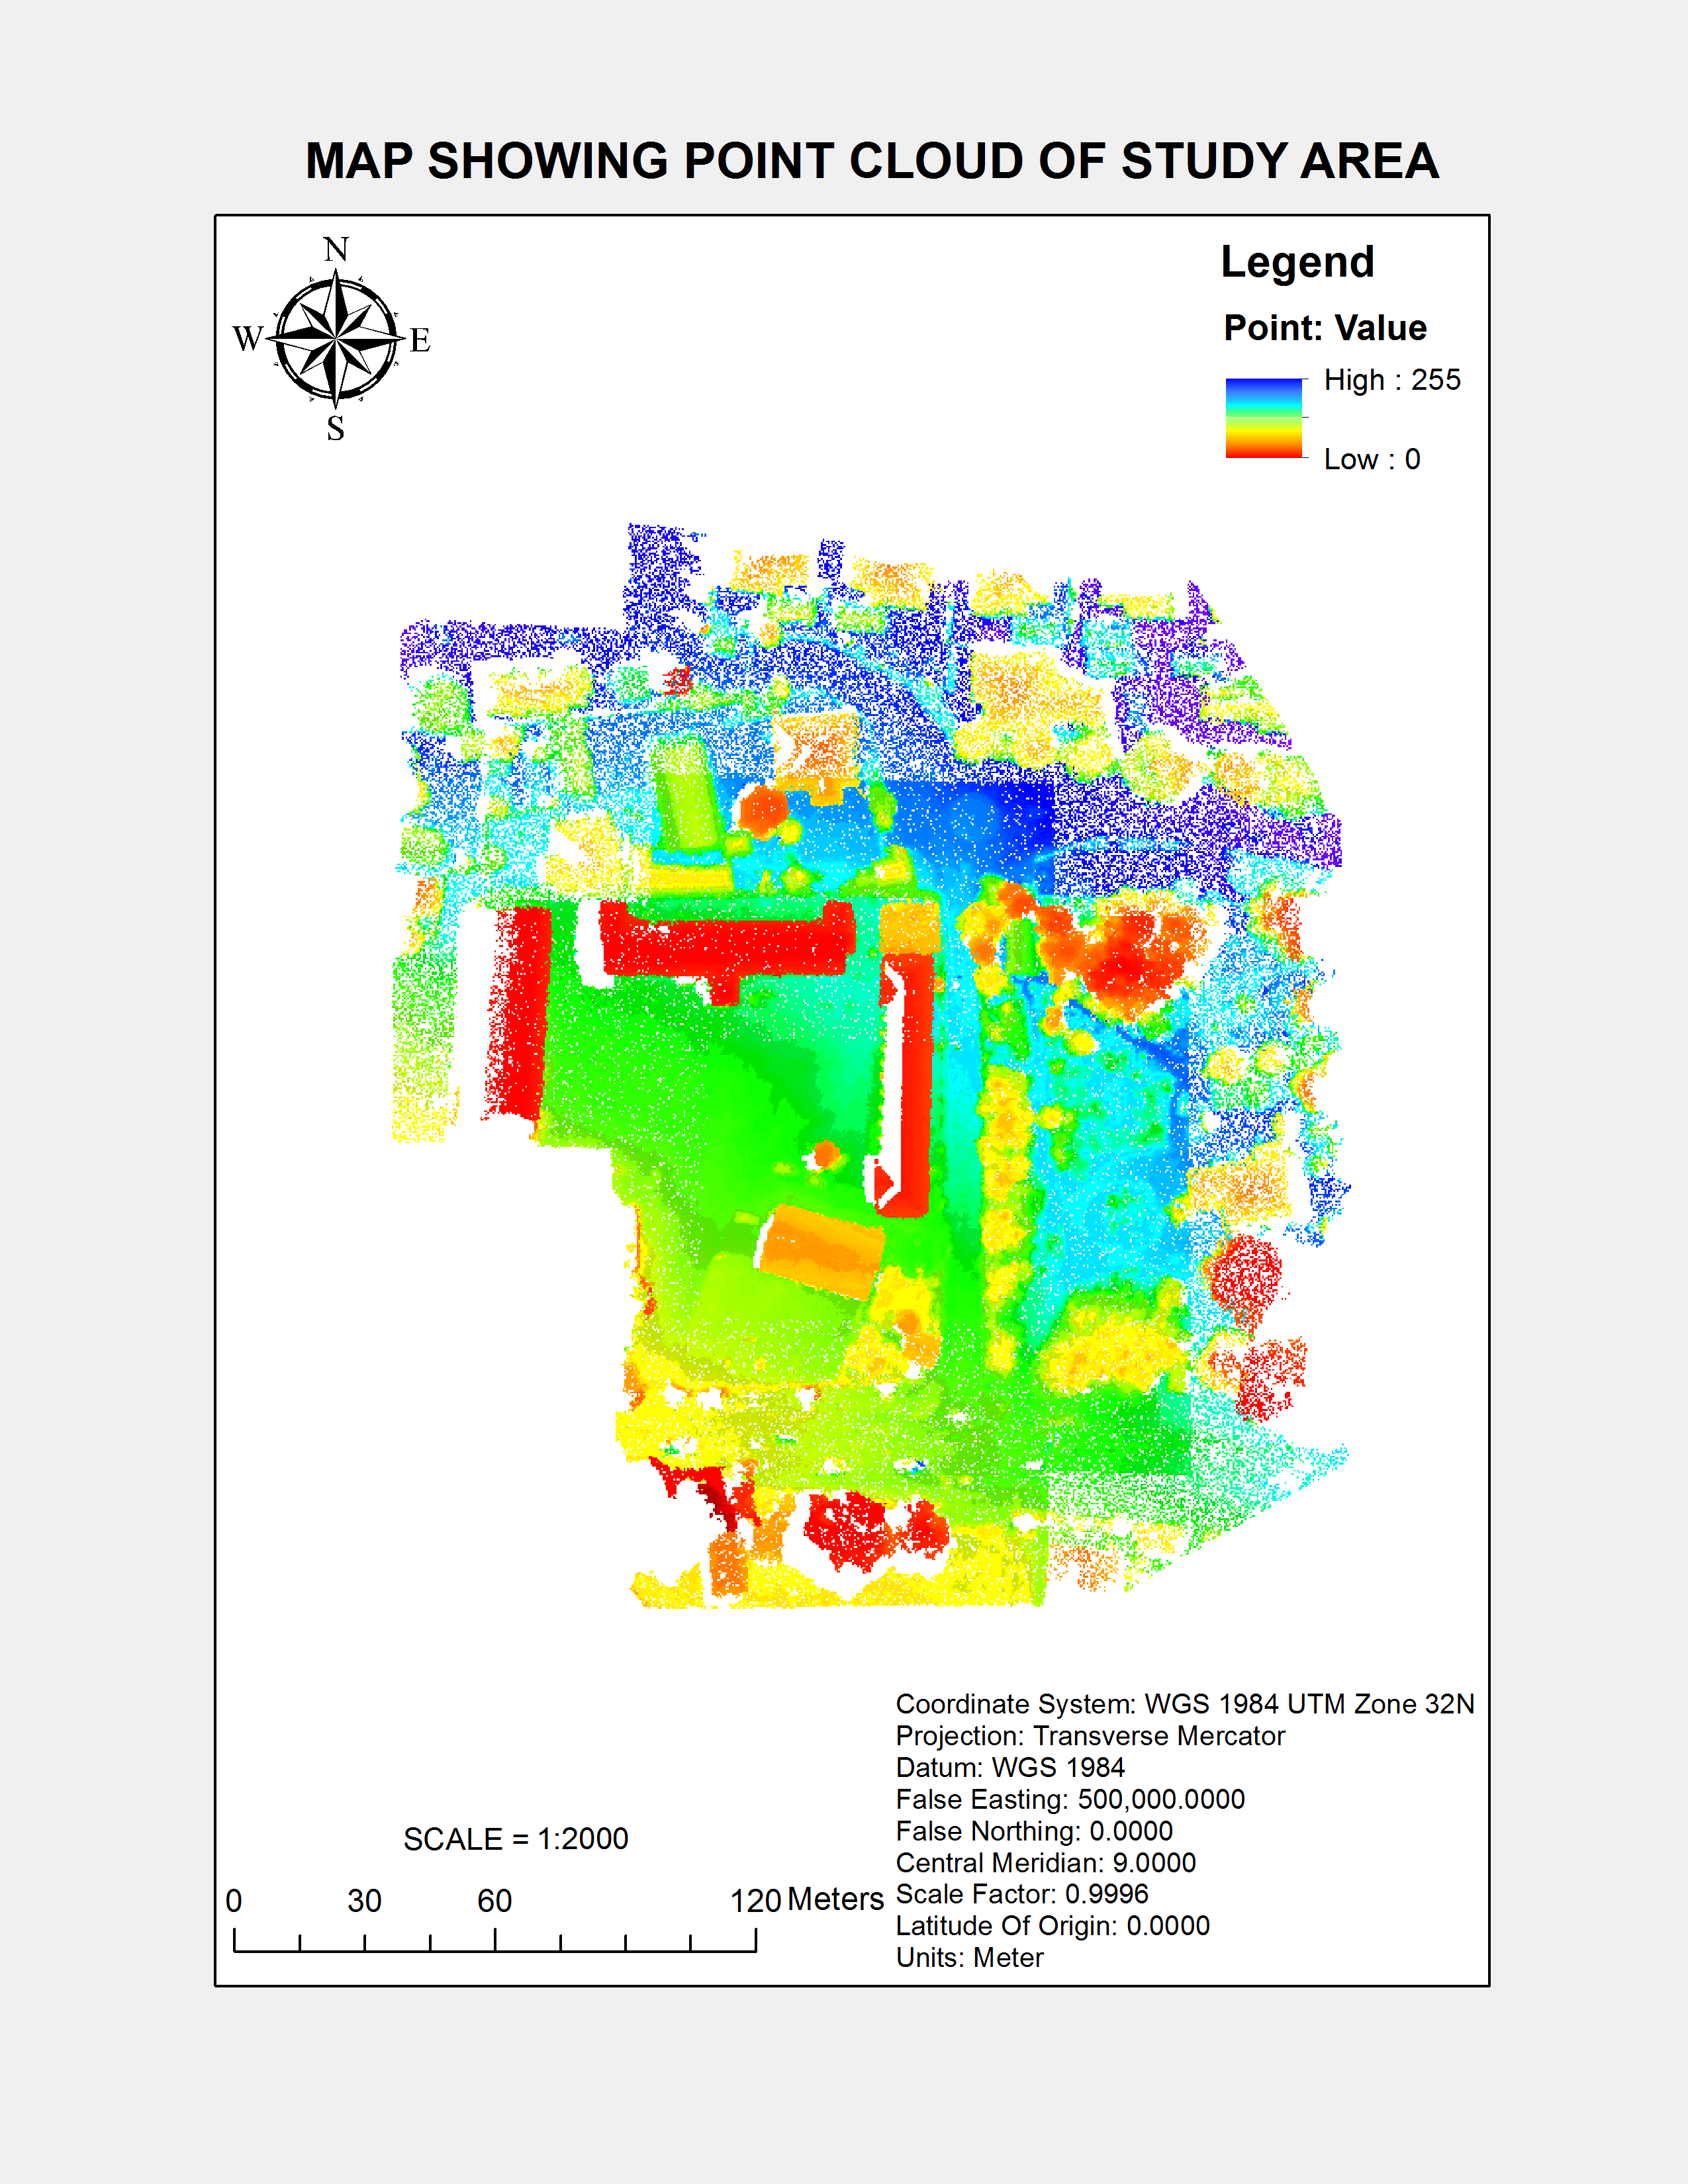
3D terrain visualization

Derived from drone/UAV imagery. Used for volume calculation, DEM extraction, and infrastructure planning.
TWI Anambra East

Topographic Wetness Index

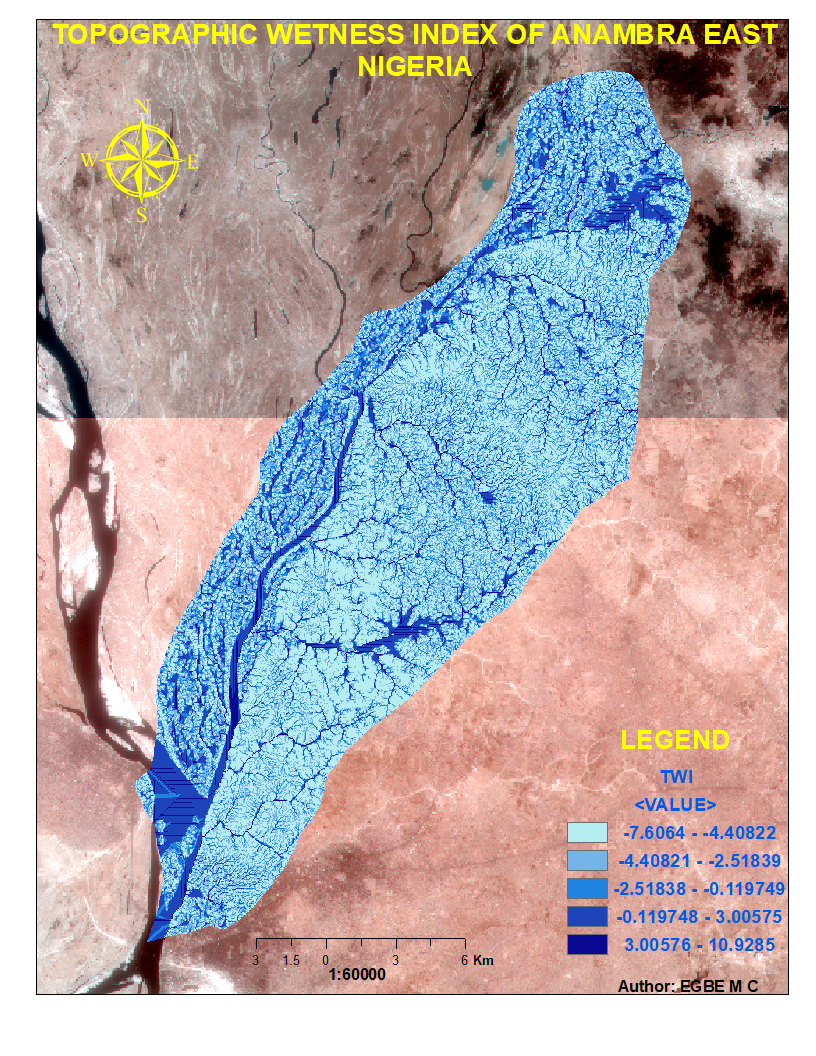
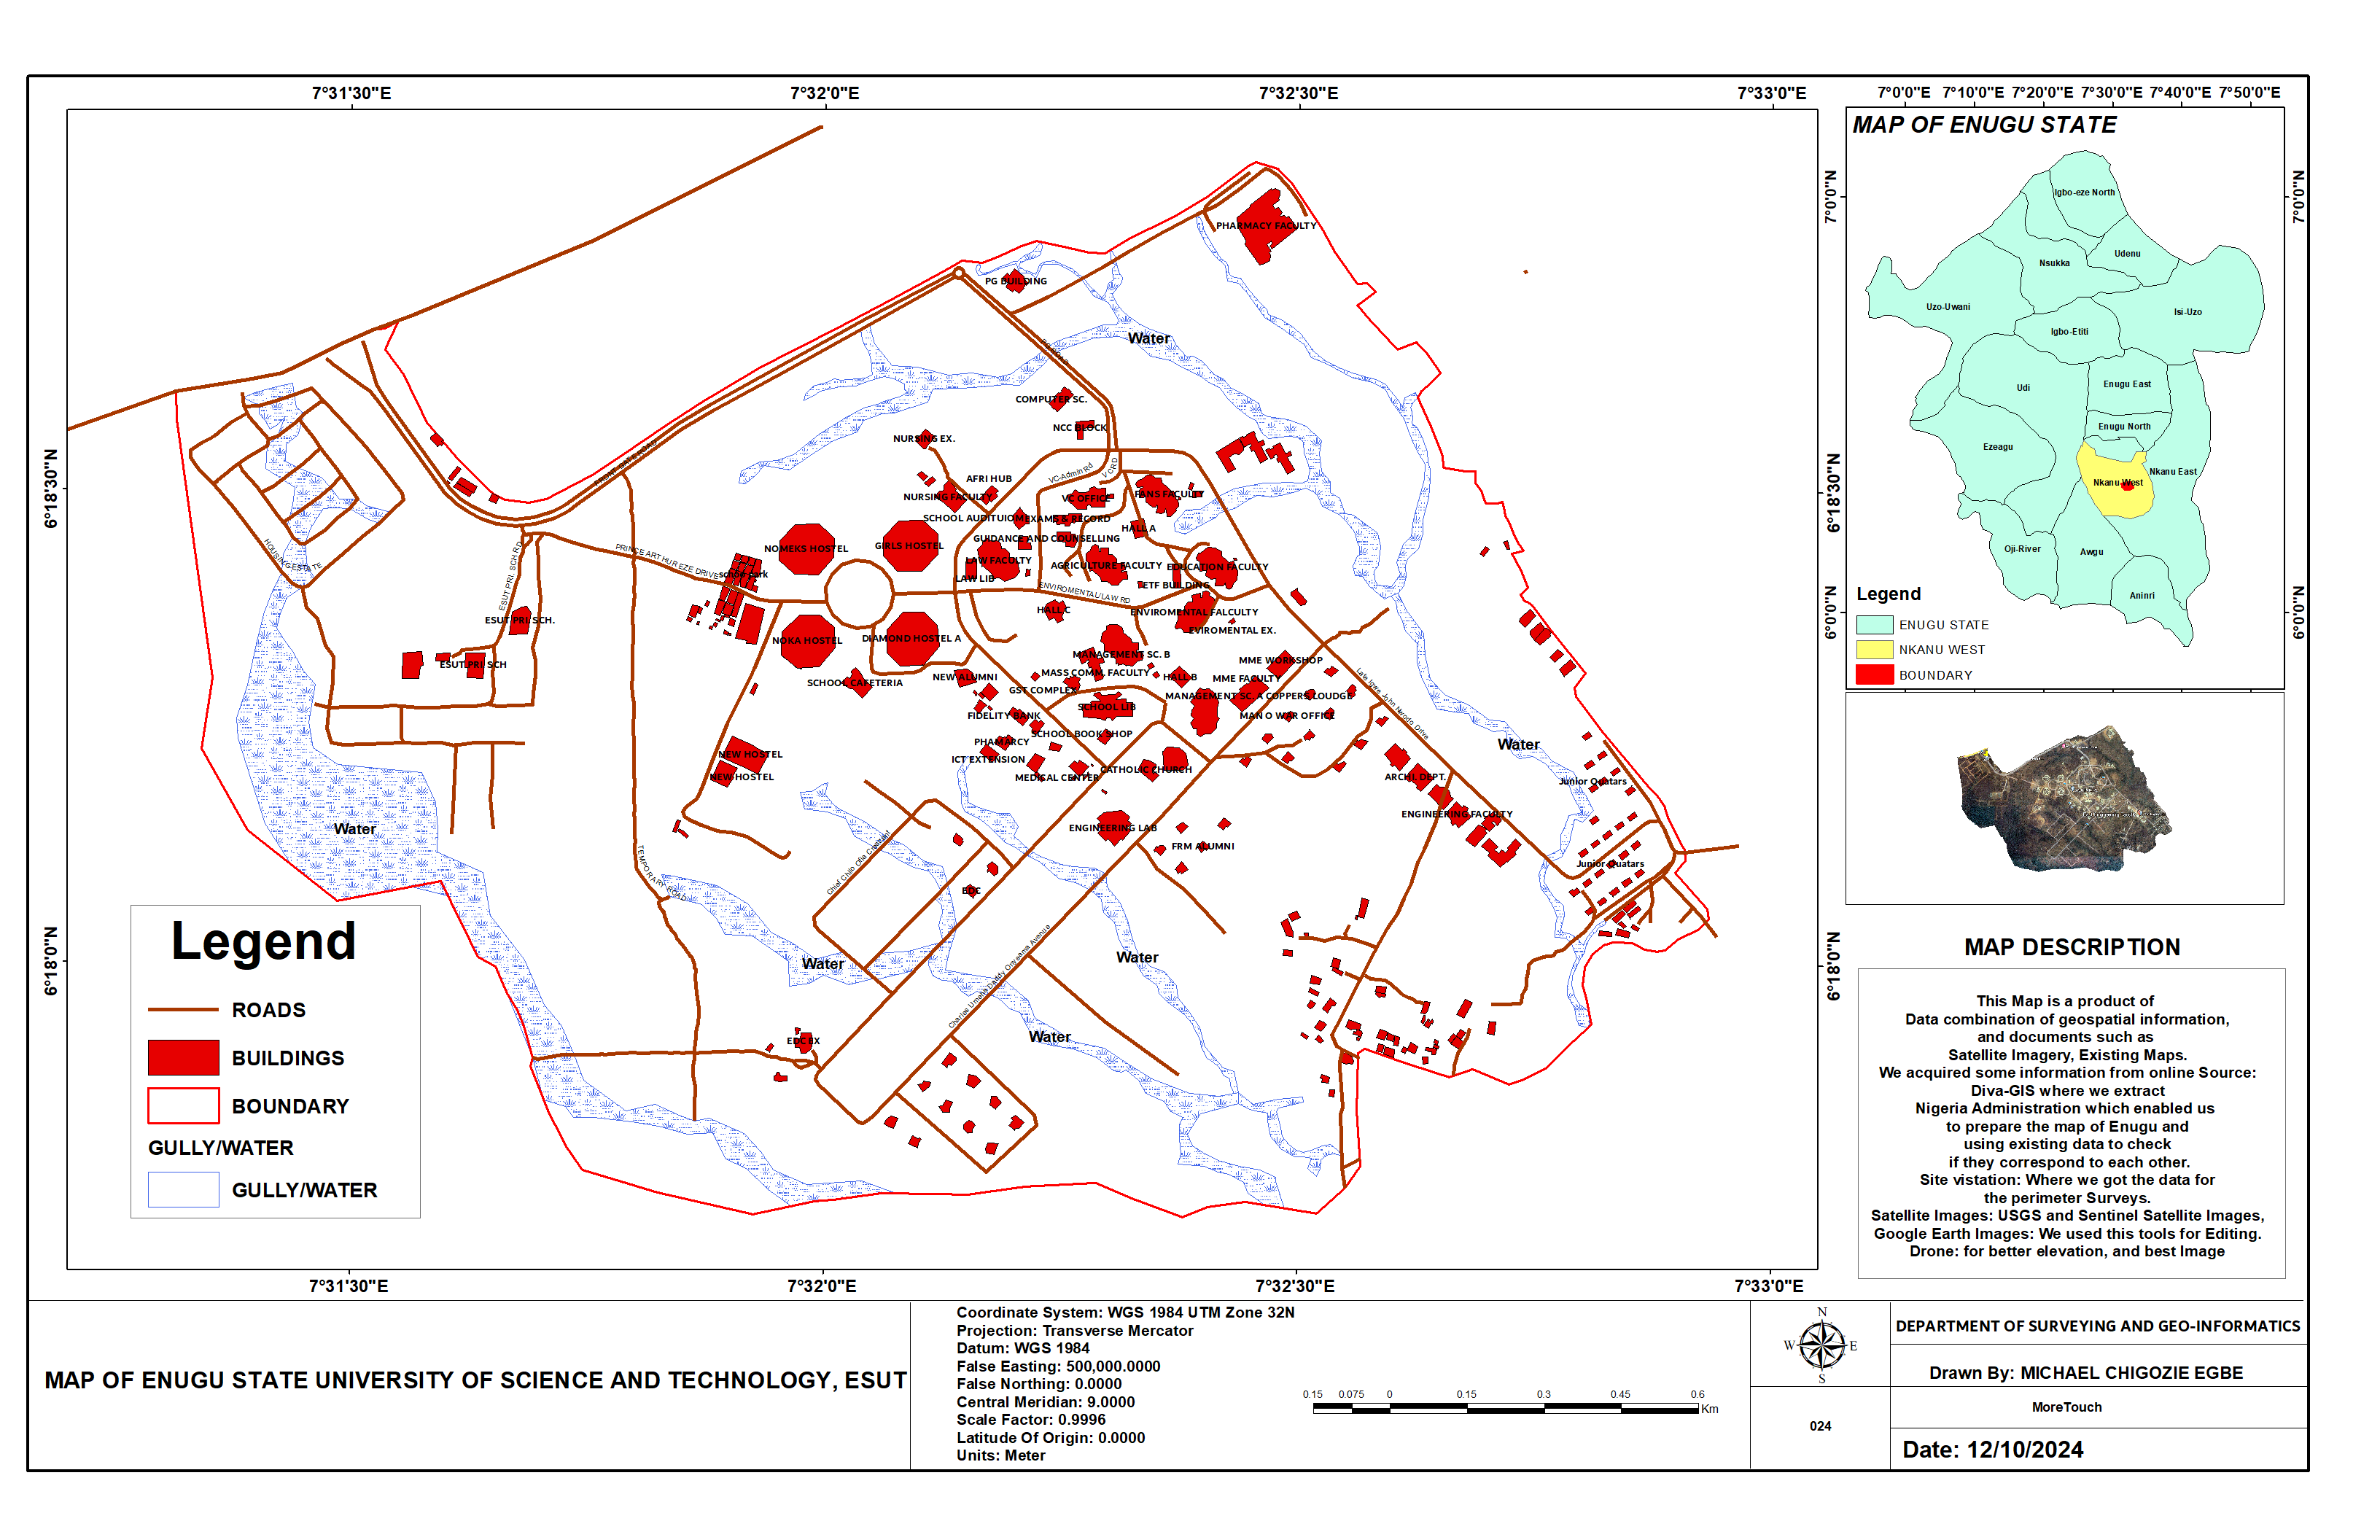
Anambra East, Nigeria

Identifies areas prone to saturation. Useful for agriculture, erosion control, and hydrology.
Food price heatmap

Food Price Heatmap (2015-23)

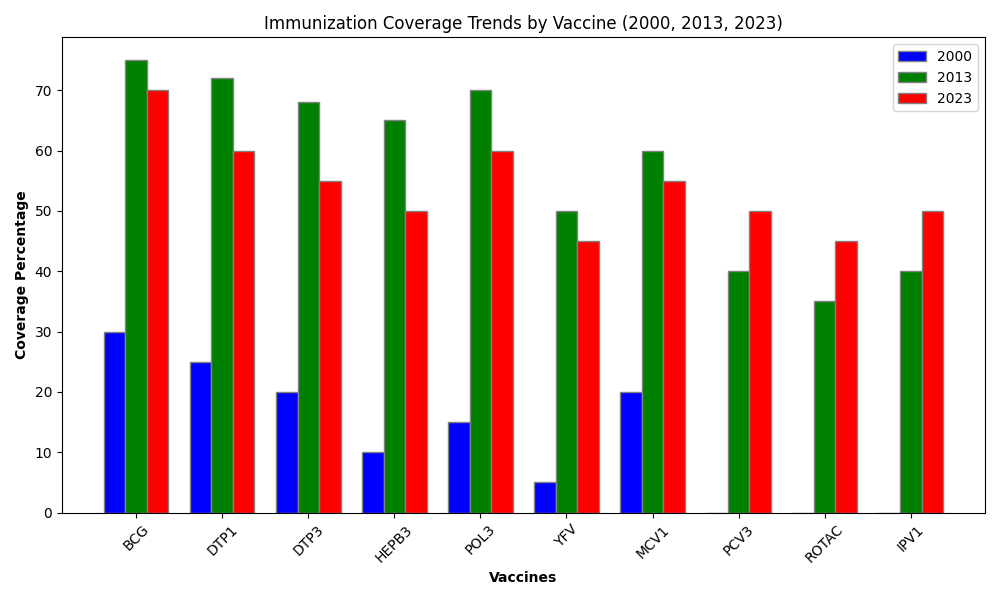
Economic trend analysis

Heatmap of staple food prices across locations. Created with Python seaborn / Excel conditional formatting.
map thematic group slope vaccine

Let’s work together